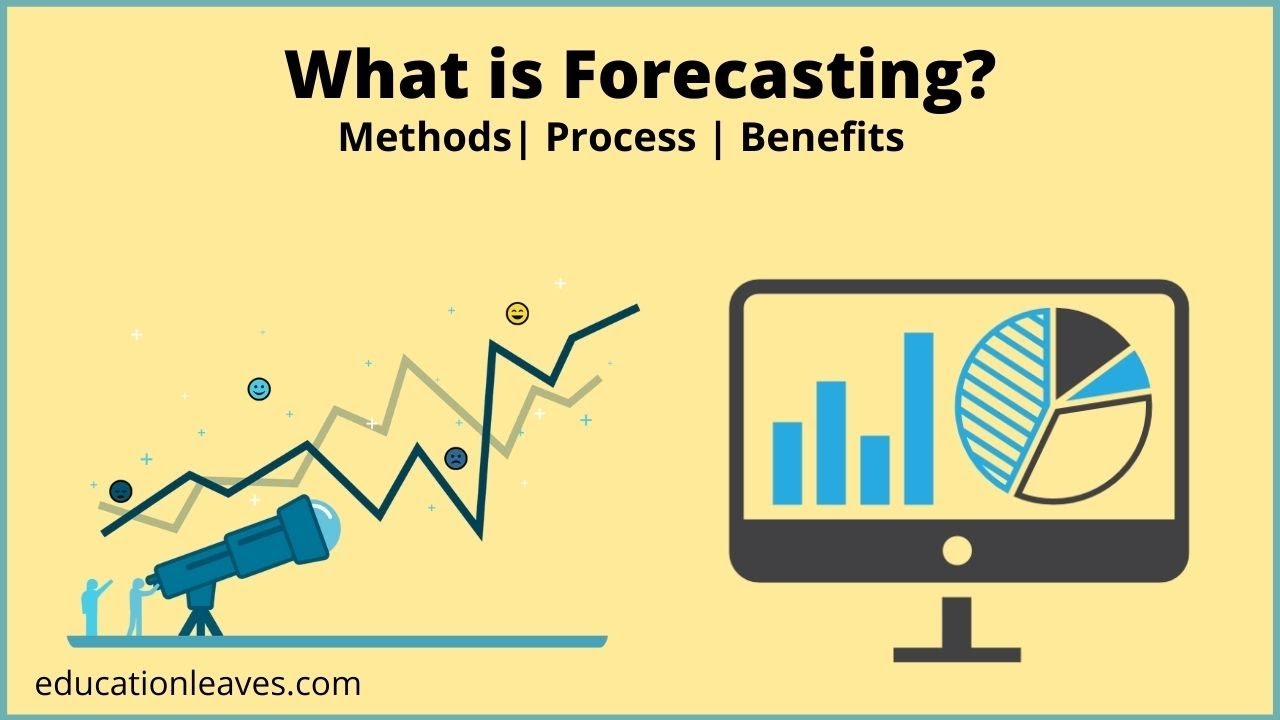
Quantitative Forecasting Methods in Business Operations
Summary
TLDRThe script delves into quantitative forecasting methods, emphasizing the importance of historical data quality for predicting future trends. It distinguishes between extrinsic and intrinsic quantitative methods, with examples like correlating weather data with ice cream sales and how cold winters in New York might influence travel bookings to Mexico. The script cautions against mistaking correlation for causation and suggests leveraging existing market research. It also touches on time series analysis for intrinsic forecasting, highlighting the limitations of relying solely on historical data for future predictions.
Takeaways
- 📊 Quantitative forecasting methods rely on historical numerical data to predict future trends, emphasizing the importance of data quality.
- 🔍 Extrinsic quantitative methods use external data, such as market or weather data, to forecast sales, like correlating ice cream sales with temperature.
- 📈 Regression analysis is a statistical tool used to identify relationships between variables, helping to predict demand based on influencing factors.
- 🌡️ Understanding causation is crucial for forecasting; correlation alone is not enough, as seen with the unrelated correlation between mozzarella cheese consumption and engineering doctorates.
- 🌟 Econometrics applies regression analysis in economic modeling, such as studying the relationship between disposable income and spending.
- 📚 Leveraging existing forecasts and market research can provide valuable insights and save resources, by building on data already analyzed by others.
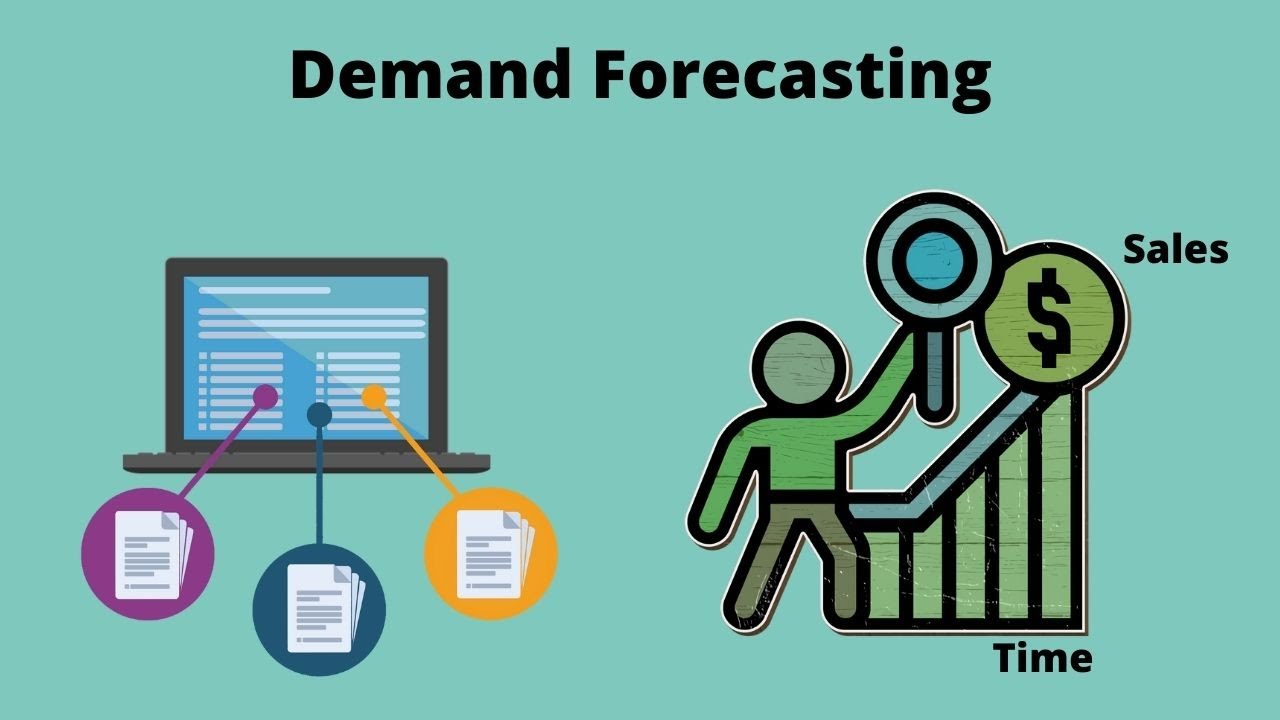
- 📉 Intrinsic quantitative methods focus on a company's internal data, often using time series analysis to predict future sales based on past performance.
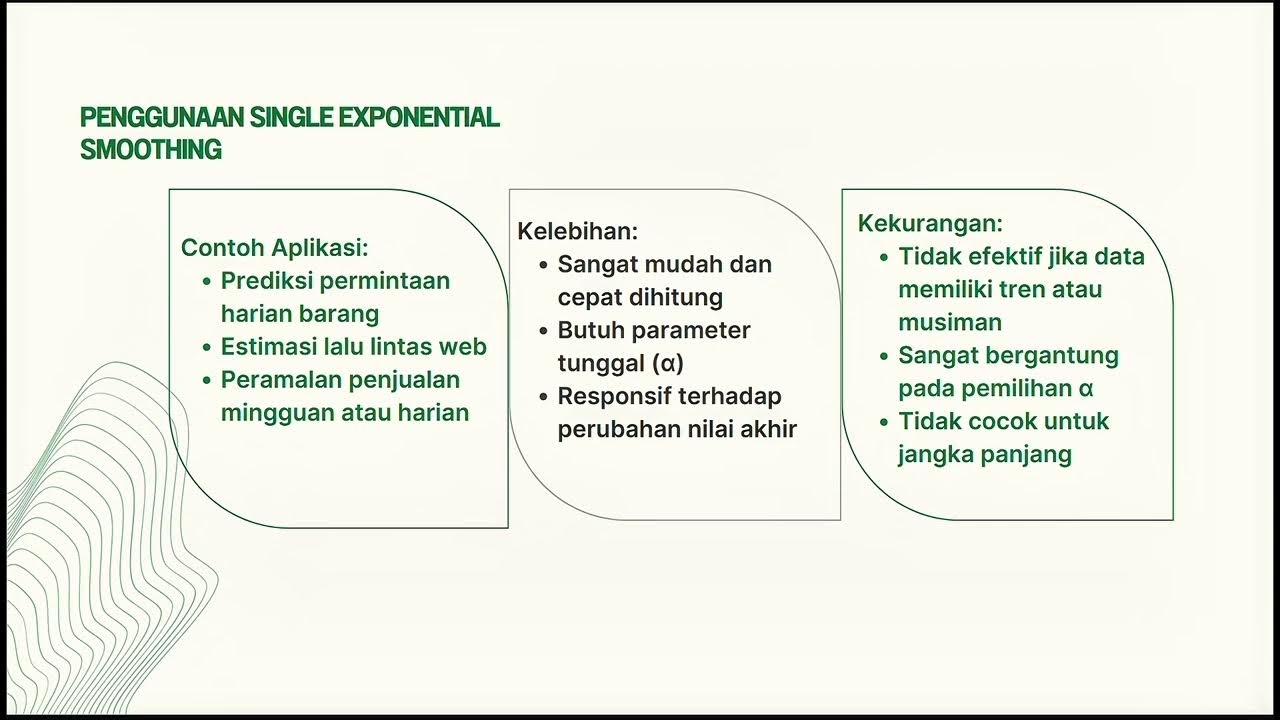
- 📉 Time series analysis includes techniques like moving averages, exponential smoothing, and more complex methods to forecast future sales trends.
- ⚠️ Historical data alone has limitations for forecasting, as it may not account for unique future events or changes in market conditions.
- 👀 The script concludes with a cautionary note on the limitations of relying solely on historical data for making predictions.
Q & A
What are quantitative forecasting methods?
-Quantitative forecasting methods involve using numerical data, typically from the past, to make predictions about future events. They require sufficient historical data to be considered valid for forecasting.
Why is historical data important in quantitative forecasting?
-Historical data is crucial as it provides the basis for identifying patterns and trends that can be used to predict future outcomes. Without high-quality historical data, the accuracy of the forecasting method may be compromised.
What is the difference between extrinsic and intrinsic quantitative methods?
-Extrinsic quantitative methods use data from external sources, such as market data or weather patterns, while intrinsic methods rely on data from within the company, such as past sales figures.
Can you provide an example of an extrinsic quantitative method?
-An example of an extrinsic method is using historical weather data to forecast ice cream sales, assuming that warmer weather is correlated with higher sales.
What is regression analysis and how is it used in forecasting?
-Regression analysis is a statistical method that tries to determine if one variable influences another. In forecasting, it can help establish causational relationships, such as how weather affects ice cream sales, which can then be used to predict future sales based on future weather forecasts.
Why is it important to differentiate between correlation and causation in forecasting?
-Differentiating between correlation and causation is important because correlation only indicates a relationship between variables, while causation implies that one variable causes changes in another. For accurate forecasting, understanding causation is essential to predict how changes in one variable will affect another.
What is econometrics and how does it relate to regression analysis?
-Econometrics is the application of statistical methods, including regression analysis, to economic data. It is used by economists to analyze relationships between economic variables and to make predictions or test economic theories.
How can existing forecasts by others be utilized in one's own forecasting efforts?
-Existing forecasts by others can be used as a reference or starting point for one's own forecasts. Understanding the data sources and assumptions used by these forecasts can provide valuable insights and help improve the accuracy of one's own predictions.
What is time series analysis and how does it apply to intrinsic quantitative forecasting?
-Time series analysis is the statistical analysis of data points collected over time. In intrinsic quantitative forecasting, it is used to analyze historical sales data to predict future sales trends.
What are some common methods used in time series analysis?
-Common methods in time series analysis include moving averages, exponential smoothing, time series decomposition, and pattern analysis. These methods help in identifying patterns and trends in historical data to forecast future values.
What is a potential limitation of using only historical data for forecasting?
-A limitation of using only historical data is that it may not account for unique or unusual events that could occur in the future, which were not present in the historical data. This can lead to inaccurate forecasts if such events significantly impact the variable being predicted.
Outlines
📊 Quantitative Forecasting and Regression Analysis
This paragraph discusses quantitative forecasting methods, emphasizing the importance of historical data in predicting future trends. It differentiates between extrinsic and intrinsic quantitative methods, with extrinsic methods using external data like market or weather data to forecast sales, such as correlating ice cream sales with temperature. The paragraph introduces regression analysis as a tool to identify causational relationships between variables, using the example of how weather might influence ice cream demand. It cautions that correlation does not imply causation and stresses the need for understanding these relationships to make accurate forecasts. The speaker also suggests leveraging existing market research and being aware of the limitations of historical data in forecasting.
🔍 Intrinsic Quantitative Analysis and Time Series Forecasting
The second paragraph delves into intrinsic quantitative analysis, which involves using a company's internal data for forecasting. It introduces time series analysis as a method for predicting future sales based on past performance. The paragraph mentions simple moving averages and more complex techniques like exponential smoothing and Fourier analysis as part of time series analysis. However, it warns of the pitfalls of relying solely on historical data, as it may not account for unique future events. The speaker also suggests examining existing forecasts by other entities to enhance one's own predictive models and to understand the data sources and assumptions behind those forecasts.
Mindmap
Keywords
💡Quantitative Forecasting Methods
💡Historical Data
💡Extrinsic Quantitative Methods
💡Intrinsic Quantitative Methods
💡Regression Analysis
💡Correlation
💡Causation
💡Econometrics
💡Time Series Analysis
💡Exponential Smoothing
💡Data Sources and Assumptions
Highlights
Quantitative forecasting methods rely on historical numerical data to predict future trends.
The validity of quantitative methods depends on the sufficiency and quality of historical data.
Extrinsic quantitative methods use data from external sources, like market or weather data, for forecasting.
Intrinsic quantitative methods utilize company-specific data for forecasting, such as past sales figures.
Regression analysis is a statistical technique used to identify relationships between variables, like weather and ice cream sales.
Understanding causation is crucial for forecasting; correlation alone is not causation.
Econometrics is the application of regression analysis in economics, often used to model economic relationships.
Historical data can be used to plot trends and make predictions, but it's important to consider the limitations of past data in predicting the future.
Time series analysis is a method of forecasting that involves analyzing data points over time to predict future values.
Simple moving averages, exponential smoothing, and time series decomposition are techniques used in time series analysis.
Regression analysis helps in identifying causation relationships by comparing historical data on influencing factors.
Existing forecasts by other research groups or consultancies can be valuable for making informed predictions.
It's important to understand the data sources and assumptions used by others when utilizing their forecasts.
Extrinsic data can overlook short-term issues and unique events that may not be captured in historical data.
Intrinsic data, while common, only uses historical company data and may not account for future unique events.
Forecasting methods should be treated with caution, as they are limited by the quality and scope of the data they are based on.
Transcripts
quantitative forecasting methods mean to
use numerical data now numerical data
only exists in the past and we need to
see if we have enough historical data
that it can be deemed valid enough to
draw some insight into what may happen
in the future
if it's not possible to get more high
quality historical numerical data then
perhaps this method isn't worth doing or
at least we should treat the outcome
with the same acceptance of low quality
as the data put into the model
we have extrinsic and intrinsic
quantitative methods from outside the
firm or data from within the thumb
so if we consider an extrinsic
quantitative method of forecasting that
could be something like drawing in
historical whole Market data such as if
you sell cars how many cars were sold in
total in your country or if you sell ice
cream Gathering historical weather data
and forecast weather data which is
relevant to match with historic sales
data then we might also do something a
little more clever with some of that
data something such as some regression
analysis I know big statistical word but
it's not so scary
regression means trying to work out if
something influences something else
now for us that could be does something
influence our demand and how
for example does the weather influence
ice cream sales I think we know the
answer to that one
finding causational relationships is
helpful because I might have some quite
good knowledge of what the weather is
going to be like tomorrow and if I knew
how the weather and ice cream sales are
correlated
I could use tomorrow's weather forecast
to help predict tomorrow's ice cream
sales
now we might all know in our hearts that
if it's a hotter day more ice cream will
be sold but by how much
if we have the weather forecast that
tomorrow will be 100 degrees Fahrenheit
how many ice creams can we forecast we
will sell based on past historical data
and past weather data
we can get historical data on ice cream
sales and other relevant things such as
the temperature on those days which we
have excellent reason to believe is an
influencing Factor now we want to
understand much better how one factor
affects our forecast demand
this is where regression analysis can
help first we need to be recording
historical data we need a database of
the historical weather and how much ice
cream we sold on those days with that
information we could plot the historical
daily weather temperature against ice
cream sales
maybe we're lucky enough to get a kind
of line of best fit
and we can see a positive correlation on
the scatter graph
and we can use that to help predict ice
cream sales tomorrow or next week based
on the weather forecast
now a slightly more complex example in
the travel industry we might have a
feeling that when there's an especially
cold winter in New York more New Yorkers
book holidays to Mexico in the summer
now if I'm a travel agent selling
holidays to Mexico such an idea is very
interesting to me so how could I test it
well again I need historical data I
might plot the previous 10 years of how
hot or cold those Winters were with the
number of holidays to Mexico sold
and if there's a pattern
if we could see a trend line
we might think that there's a
correlation
now correlation when one variable seems
to have a connection or relationship
with another variable does not mean
causation causation means that one
variable caused the other correlation is
not causation
and we need to be finding causation
relationships because we want to use it
to predict our dependent variable our
demand
as a silly example of random things that
have been found to happen to be
correlated but clearly are not caused by
each other someone once who the hell
knows who or why someone once found that
the plot of the per person consumption
of mozzarella cheese in the United
States every year going back over a
decade happened to correlate extremely
well with the number of engineering
Doctorate Degrees awarded
fascinating but here in such a silly
example I think we can see that there's
no causation between the two but they
are very well correlated over that time
period
now this is a whole field of statistical
science that could probably be talked
about for weeks on its own
it's just important to remember that
regression means making a hypothesis I
think this might influence demand
taking historical data on both variables
comparing them and seeing if there's a
trend and probably using some common
sense on whether it's possibly plausibly
a causation relationship or just a
coincidental coincidental correlation
you may have heard of the phrase
econometrics
econometrics is really the same thing
during regression analysis but for
economists
economists can use regression analysis
when trying to make their economic
models
they might be seeing if one factor
relates to another Factor such as does
the disposable income of a group of
people correlates with their expenditure
their spending
now I'm sure they do lots of clever
stuff and we don't need to understand
all of it
but it's possible that some of these
clever people or other research groups
have already done some big market
research that we can simply find and use
to help our forecast
so top forecasting tip see what existing
forecasts have already been made by
others
maybe you sell cars and the national
Automobile Association have already had
a multi-million dollar analysis of the
Future car sales of the USA done by some
Mega consultancy and published their
findings
see if you can find and use such data
that might help your team make your own
forecast
to get even more value from it find out
what data sources they used and what
assumptions they made
now some of the problems with using this
extrinsic data this extrinsic analysis
is that it can be blind to short-term
issues
the historical data may have had major
unique events that influenced it and it
simply can't take account of the unusual
events that may happen in the future
even if everybody knows something
special is going to happen next month
intrinsic quantitative analysis means
using numerical data from inside the
company this is probably the most common
method of forecasting simply looking at
the quantity of what we've sold made
done in the past and using that to guide
what we will probably sell in the future
now this also has a big name it can be
called time series analysis
but it basically just means to analyze a
data series a data set over a historical
time period and trying to use that
statistically to estimate calculate what
could be in the future
the most mainstream time series analysis
method might be using a simple moving
average of the last few days the few
months or years of historical data to
help predict next month or next year
and there are also some common but
slightly more mathematically
sophisticated ways of using that data to
help extrapolate into the future such as
exponential smoothing or some really big
words like time series decomposition
pattern analysis Fourier analysis it's a
science in its own right
but the problem with looking at
historical data alone to try and predict
the future is simply that it's only
using history it's a bit like trying to
drive your car by looking in the rear
view mirror
so
Beware of the limitations of only using
historical data however much
mathematical magic the Wizards have done
to it
[Applause]
[Music]
[Applause]
[Music]
[Applause]
[Music]
[Applause]
[Music]
thank you
[Music]
تصفح المزيد من مقاطع الفيديو ذات الصلة
Analisis Deret Berkala - Pengantar Statistika Ekonomi dan Bisnis (Statistik 1) | E-Learning STA
How to Do Market Research!
Qualitative Data Explained | Comparison to Quantitative Data | Data Examples | How to Analyze
Research Design: Decide on your Data Analysis Strategy | Scribbr 🎓
Practical Research 2 Lesson 1: Introduction to Quantitative Research
PR2 - Introduction to Quantitative Research: Definition of Quantitative Research
5.0 / 5 (0 votes)