Build a Dynamic 3 Statement Financial Model From Scratch

Kenji Explains
13 Feb 202232:26

Summary

TLDRIn this instructional video, Kenji guides viewers through creating a dynamic three-statement financial model linking the balance sheet, income statement, and cash flow statement. He details the process from organizing the income statement with key assumptions to building out the other components and ensuring the model's interconnectivity. The model serves as a foundation for financial analysis and valuation methods like discounted cash flow and M&A modeling. Kenji also offers a free downloadable file and touches on formatting and formula techniques in Excel.

Takeaways

  • 📊 The video provides a step-by-step guide to creating a dynamic three-statement financial model that links the balance sheet, income statement, and cash flow statement.
  • 🔗 The model begins with organizing and building an income statement based on a set of assumptions, which is essential for financial analysis and serves as a foundation for valuation work like discounted cash flow or M&A models.
  • 📈 The script demonstrates how to format and calculate the income statement, including adjusting for items like revenue, discounts, and cost of goods sold (COGS).
  • 🏢 It explains the importance of distinguishing between historical and estimated figures in financial statements, particularly when dealing with balance sheets as they represent a snapshot at a specific time.
  • 💻 The video script includes Excel shortcuts and functions like `EDATE`, `ALT`, and `CTRL` combinations for efficient data manipulation and formatting within the financial model.
  • 🔑 Key financial concepts such as EBITDA (Earnings Before Interest, Taxes, Depreciation, and Amortization) are introduced, highlighting their significance in profitability measurement and company comparison.
  • 🛠️ The script covers the creation of a depreciation schedule, which is crucial for allocating the cost of tangible assets over their useful life, affecting the income statement and balance sheet.
  • 🔄 The importance of linking the three financial statements is emphasized, ensuring that changes in one statement are reflected in the others to maintain accuracy and consistency.
  • 💡 The video mentions the use of assumptions for accounts receivable, payable, and deferred revenue, which are dynamically calculated as percentages of revenue or COGS, affecting the balance sheet.
  • 📉 The script details the process of forecasting future financial figures based on historical data and percentages, which helps in projecting the company's financial health.
  • 🌐 The video concludes with the creation of a cash flow statement, which is vital for understanding the company's liquidity and is used to reconcile the balance sheet's cash figure.

Q & A

  • What is the purpose of creating a dynamic three-statement model?

    -A dynamic three-statement model is used for regular financial analysis and as the foundation for valuation work such as discounted cash flow, LBO, or M&A models.

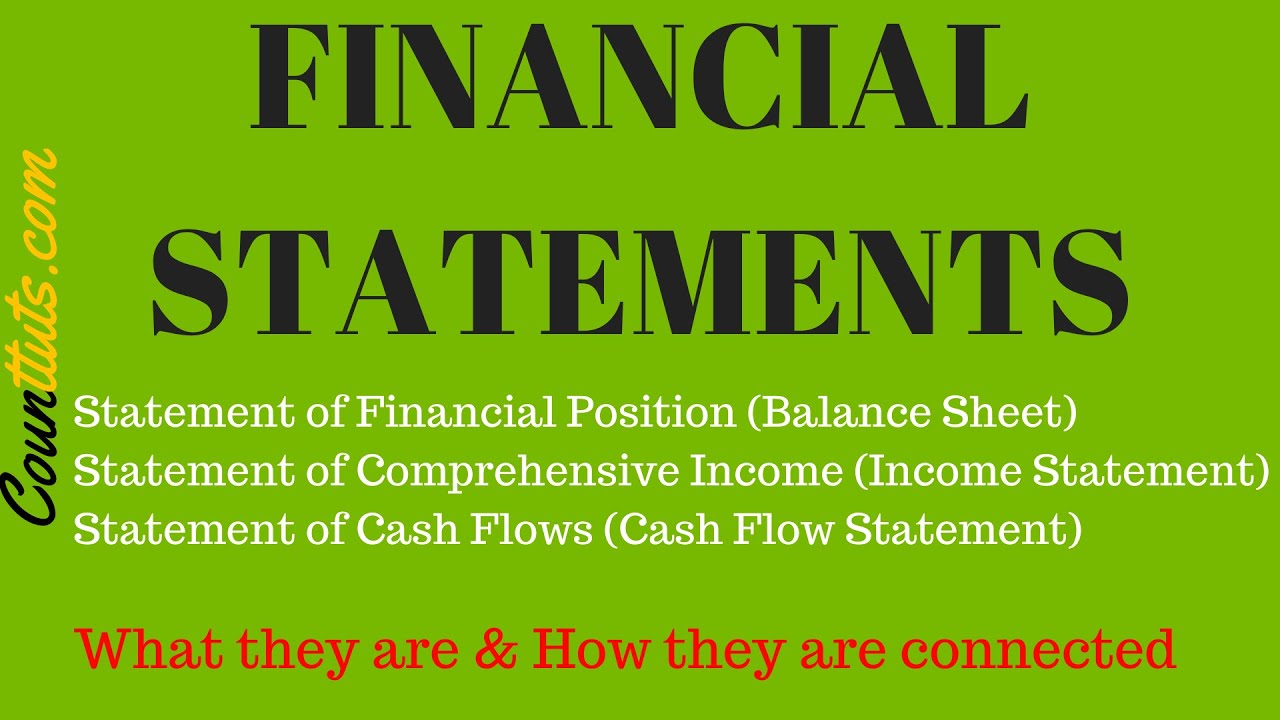
  • What are the three main financial statements that the video focuses on linking together?

    -The video focuses on linking the balance sheet, the income statement, and the cash flow statement.

  • What is the first step in building the financial model as described in the video?

    -The first step is to organize and build the income statement using a set of assumptions.

  • How does the video suggest formatting the income statement in Excel?

    -The video suggests using Excel shortcuts like Alt + H6 for indents, Ctrl + B for bold, and Alt + HB for borders to format the income statement.

  • What is the significance of using 'EDATE' function in the income statement?

    -The 'EDATE' function is used to automatically calculate the end date for each year, which is useful for a statement that covers a range of periods like a full year.

  • How are the assumptions for the financial model represented in the Excel file?

    -Assumptions are represented in blue and are hardcoded, meaning they are typed in directly without being part of a formula.

  • What is the reason for making certain assumptions a percentage of revenue?

    -Making certain assumptions a percentage of revenue allows for dynamic calculations that adjust based on the revenue, ensuring the model remains proportional and accurate.

  • Can you explain the meaning of EBITDA as mentioned in the video?

    -EBITDA stands for Earnings Before Interest, Taxes, Depreciation, and Amortization. It is a measure of a company's profitability that allows for comparison between companies by omitting the effects of taxes and other non-cash expenses.

  • What is the role of the 'Fixed Assets Schedule' in the financial model?

    -The 'Fixed Assets Schedule' helps in calculating depreciation and amortization, which are then linked back to the income statement to account for the cost allocation of assets over their useful life.

  • How does the video suggest handling the interest expense in the income statement?

    -The interest expense is handled by linking it to the balance sheet where the interest payment is calculated based on the interest rate and the debt amount.

  • What is the final step to ensure the accuracy of the three-statement model?

    -The final step is to create a cash flow statement and then use it to fill in the missing cash balance in the balance sheet. The accuracy is confirmed when the balance check shows all zeros.

Outlines

00:00

📊 Introduction to Building a Three-Statement Financial Model

Kenji introduces a tutorial on creating a dynamic three-statement financial model that interlinks the balance sheet, income statement, and cash flow statement. He mentions a downloadable file for practice and outlines the steps: organizing the income statement with assumptions, creating schedules for complex items, building the balance sheet, and linking all three statements. The model's utility is highlighted for financial analysis and valuation work such as discounted cash flow, LBO, or M&A models. The Excel file structure is also briefly discussed.

05:01

🔍 Formatting and Filling the Income Statement

The process of setting up the income statement begins with formatting tips like removing gridlines and customizing date formats to represent fiscal years. Kenji formats the income statement for a hypothetical lemonade stand startup, detailing steps like indenting items, adding borders, and adjusting cell formats. Assumptions for revenue, costs, and taxes are hardcoded in blue, signifying static values. He demonstrates how to make these values dynamic by linking them to the income statement, using formulas and formatting to reflect percentages of revenue.

10:02

📈 Completing the Income Statement with Formulas

Kenji continues by filling in the income statement with formulas for calculating gross revenue, discounts, net revenue, and costs. He explains the use of absolute and relative cell references in formulas and the importance of formatting for clarity. The video script includes step-by-step instructions for calculating COGS, gross profit, operating expenses, and EBITDA, emphasizing the significance of EBITDA in comparing company profitability. The process of copying and pasting formulas for automation is also covered.

15:04

🏭 Depreciation and Amortization in the Fixed Asset Schedule

This section focuses on the fixed asset schedule for calculating depreciation and amortization. Kenji explains the concept of depreciation as a cost allocation over an asset's useful life. The script details the setup of a depreciation table, including the allocation of costs for various assets like a lemon crusher, ice machine, and refrigerator, and how to handle assets with different lifespans. The process of linking the depreciation back to the income statement is also discussed.

20:07

💼 Building the Balance Sheet and Linking to Other Statements

The script moves on to constructing the balance sheet, starting with formatting historical and estimate figures, and explaining the difference between actual and estimate data. Kenji covers how to calculate totals for assets, liabilities, and equity, and the importance of the balance check for accuracy. He also details the process of creating dynamic links for accounts receivable, payable, and deferred revenue based on percentages of revenue or COGS, and how to forecast these figures for future periods.

25:11

🚀 Finalizing the Balance Sheet and Preparing the Cash Flow Statement

Kenji wraps up the balance sheet section by discussing non-current assets, accumulated depreciation, and net fixed assets. He explains the handling of debt, equity, and retained earnings, including how to calculate interest payments. The script also introduces the creation of the cash flow statement, starting with the net income and operating activities, and explains the rationale for adding back depreciation as it's a non-cash charge. Changes in accounts receivable and payable are discussed in the context of their impact on cash flow.

30:17

💼 Summarizing the Cash Flow Statement and Model Validation

The final paragraph deals with completing the cash flow statement by addressing investing and financing activities, including CAPEX and debt repayments or borrowings. Kenji explains how these elements affect cash flow and the importance of ensuring the balance sheet and cash flow statement are consistent. The script concludes with the validation of the model by checking that the balance sheet balance is zero, indicating correct calculations throughout the financial model.

Mindmap

Keywords

💡Dynamic Three Statement Model

A dynamic three statement model is a financial tool that interlinks the balance sheet, income statement, and cash flow statement to provide a comprehensive view of a company's financial performance over time. It's dynamic because it can be adjusted for different scenarios and time periods. In the video, the creator walks through the process of building this model step by step, starting with the income statement and eventually linking it to the balance sheet and cash flow statement.

💡Balance Sheet

The balance sheet is a financial statement that presents a company's assets, liabilities, and shareholders' equity at a specific point in time. It is part of the three statement model and is used to assess the company's financial position. In the script, the balance sheet is formatted and filled with historical and estimated figures, showing the company's financial snapshot at the end of each year.

💡Income Statement

The income statement, also known as the profit and loss statement, reports a company's financial performance over a specific accounting period, typically a fiscal quarter or year. It shows revenue minus expenses to arrive at the net income. In the video, the income statement is constructed using various assumptions, and calculations for revenues, costs, and profits are demonstrated.

💡Cash Flow Statement

The cash flow statement provides information about a company's cash inflows and outflows during a period. It is one of the three core financial statements and is essential for understanding the liquidity of a business. In the video script, the cash flow statement is created to reconcile the changes in cash and to ensure that the model's financial statements are consistent with each other.

💡Capital Expenditures (CapEx)

Capital expenditures refer to the funds a company uses to acquire or improve its fixed assets. These are significant investments that a company makes to maintain or increase the scope of its operations. In the script, CapEx is used to calculate depreciation schedules and is an essential part of the balance sheet and cash flow statement.

💡Depreciation

Depreciation is the systematic allocation of the cost of a tangible asset over its useful life. It is used to reflect the decline in value of assets over time. In the video, the process of calculating depreciation for various assets like a lemon crusher, ice machine, and refrigerator is explained, showing how it affects the income statement and balance sheet.

💡Assumptions

In the context of financial modeling, assumptions are the预估 or estimates made about future conditions that affect a company's financial performance. These might include sales forecasts, cost estimates, and market conditions. The script describes how a set of assumptions is used to project the income statement, balance sheet, and cash flow statement.

💡EBITDA

EBITDA stands for Earnings Before Interest, Taxes, Depreciation, and Amortization. It is a measure of a company's financial performance and is used to compare the profitability of companies. In the video, EBITDA is calculated as part of the income statement to provide an indicator of the company's operating performance without the impact of non-operational items.

💡Financial Analysis

Financial analysis is the process of evaluating a company's financial statements to determine its efficiency and effectiveness in managing funds to maximize value. In the video, the dynamic three statement model is highlighted as a tool for regular financial analysis, helping to understand the company's overall financial health.

💡Valuation

Valuation in a financial context refers to the process of determining the economic value of an asset or a company. The three statement model created in the video serves as a foundation for various types of valuation work, such as discounted cash flow analysis or leveraged buyout (LBO) modeling, which are essential for investment decisions and business strategy.

💡Excel Formatting

Excel formatting refers to the process of arranging data, applying styles, and adjusting the presentation of cells in a spreadsheet to improve readability and appearance. Throughout the script, various Excel formatting techniques are used, such as hiding gridlines, applying borders, and customizing date formats, to make the financial model more professional and easier to understand.

Highlights

Introduction to creating a dynamic three-statement financial model linking the balance sheet, income statement, and cash flow statement.

Availability of a downloadable file for the financial model used in the video.

The model's utility for regular financial analysis and as a foundation for valuation work such as discounted cash flow, LBO, or M&A models.

Step-by-step guide begins with organizing and building an income statement using a set of assumptions.

Explanation of using Excel functions like EDATE to project future dates for financial estimates.

Customization of date formats in Excel to represent fiscal years for income statement periods.

Formatting tips for enhancing the readability of financial statements in Excel.

Assumptions for a lemonade stand company, including revenue, discounts, raw materials, and operating expenses.

Demonstration of making assumptions dynamic by linking them to revenue percentages.

Building the balance sheet with historical figures and estimates for accounts receivable, fixed assets, and liabilities.

Explanation of the difference between historical actuals and forward-looking estimates in financial modeling.

Linking the income statement with the balance sheet to calculate key financial metrics.

Creating a depreciation schedule for fixed assets and understanding its impact on the income statement.

Calculating total depreciation and amortization and linking it back to the income statement.

Introduction of an Excel course for business and finance, aimed at enhancing practical Excel skills for industry professionals.

Finalizing the income statement with interest expense calculation linked to the balance sheet.

Building the cash flow statement from net income, adjusting for non-cash items, and changes in working capital.

Reconciliation of the balance sheet with the cash flow statement to ensure internal consistency.

Importance of the balance check in ensuring the accuracy of the financial model.

Conclusion emphasizing the model's role as a foundation for various types of financial valuation.

Transcripts

play00:00

what's up everyone it's kenji here and in this  video we're going to be creating a dynamic  

play00:03

three statement model where we'll be linking the  balance sheet the income statement and the cash  

play00:08

flow statement and you can download the file i'll  be working with for free as i'll leave it in the  

play00:12

description below so let's get into it and here's  the steps we'll take to make this financial model  

play00:17

firstly we'll organize and build our  income statement using a set of assumptions  

play00:21

secondly we'll create schedules to model out more  complex line items like capital expenditures and  

play00:26

depreciation following that we'll build out our  balance sheet and lastly we'll build up the cash  

play00:31

flow statement and link the three statements  together and in case you're wondering when a  

play00:35

three statement model is useful on the one hand  it's just for regular financial analysis and on  

play00:40

the other hand this is usually the foundation  for any sort of valuation work that you might do  

play00:44

like for example a discounted cash flow an lbo  or an m a model as well so if we get into the  

play00:49

excel file here we've got the income statement if  you go control page down you can find the balance  

play00:54

sheet the statement of cash flows and the fixed  asset schedule so firstly let's start off with  

play00:58

the income statement press the alt w vg which is  going to get get rid of those grid lines which are  

play01:04

sometimes a bit annoying and this financial model  will be building is for a lemonade stand company  

play01:09

in its early stages like say a startup let's get  started with the income statement first so over  

play01:13

here you'll see that we have the year and let's  move that along to all of the other years as well  

play01:17

so for that we can do a formula like the edate so  equals e8 press the tab key the start date is the  

play01:23

previous years comma and then number of months  ahead so that's going to be in 12 months time  

play01:28

so put a 12 there that's going to give you 2023  and we want to move that along all the way to  

play01:32

these other years once we have that we want to  change the type of date here into something like  

play01:37

the year and then the e letter for the estimate  in this case so press the ctrl one key for that  

play01:42

and from there we're gonna go to custom and we're  going to customize the type of date here so what  

play01:47

we're gonna do is put the y four times which  is gonna stand for the years then we'll put  

play01:51

this sign over here which is like a dash and then  followed by that we'll we'll put a capital e which  

play01:56

is going to be the estimate equivalent press  enter that should change everything into this  

play02:01

the reason we just won the year instead of an  actual date is because the income statement is  

play02:05

usually for a range of period like one entire year  while on the other hand the balance sheet is for a  

play02:09

snapchat so a particular day this case is for a  whole year let's also start formatting the rest  

play02:14

of the income statements so we'll put some indents  over here for the gross revenue and the discounts  

play02:18

press the shift down arrow to select it from there  you'll go to alt h6 which is going to in them them  

play02:22

for us and after that let's also add some borders  here on the net revenue so press the ctrl b  

play02:27

first to bolt on it and then we'll go to alt  hb and let's say we want to add some borders  

play02:33

just above it so for that we will just press  the p key like so same thing over here so for  

play02:38

the cogs we would have to indent all of the  cogs here so alt h six put a bolt sign over  

play02:43

here for the total coke so control b and same  thing alt h b p and you get the general idea  

play02:49

so i'm just going to fast forward this whole  process so you don't have to keep looking at it

play02:58

once we have things formatted the way we like  them in the income statement we can go to the  

play03:01

very bottom by just pressing the ctrl and the down  arrow and over here you'll find a different set of  

play03:05

assumptions so these are all the assumptions  that we've made about the lemonade stand and  

play03:09

how we think it's going to perform so for example  for a revenue it would be the cup sold over here  

play03:14

the average price of the cup and any discounts  that we might have then we have the different  

play03:18

raw materials like what might be buying the  actual lemons the ice and things like that as  

play03:22

well as other operating expenses so these are  things like these salaries that we might have  

play03:27

any office or rent space that we might incur and  then lastly we have the tax rate which well it's  

play03:32

just inevitable right and you'll probably notice  that all of these assumptions are in blue that's  

play03:36

generally the convention you'll have them in this  color when they're hardcoded meaning that they're  

play03:40

not an actual formula and you just type the number  in yourself let's also format this area a bit more  

play03:45

just by putting a few indents so ctrl shift  down arrow to select all of that then alt h6  

play03:50

same thing over here ctrl shift down arrow alt h6  and same thing over here alt h6 for some of these  

play03:57

assumptions here you'll notice that there actually  as a percentage of revenue like the discounts here  

play04:02

raw materials etc so for that we're actually going  to change it so it's dynamic and it looks like it  

play04:06

so we'll go to equals and then control up all the  way till we reach b6 here press the ampersand and  

play04:13

then we'll put a quotation first quotation here  put a space and as a percentage percentage sign of  

play04:21

revenue of rev should be fine and then we'll go  close the quotations and just like so and then  

play04:27

press enter and now you can see we actually forgot  to put the space here in between the discount and  

play04:31

as the percentage of rev so press the f2 key  to get back inside the formula and let me just  

play04:36

add the space over here generally when you put an  ampersand and any quotations you can put whatever  

play04:41

you want within that sentence so in this case  we made it like this so now that we have that  

play04:46

we can actually just drag it down so we'll go  ctrl c and drag it all the way all the way to  

play04:50

this here so we've got raw materials fulfillment  and now because it's all dynamic it should be  

play04:54

linked to the right one same thing down over here  we'll press the shift down arrow and then ctrl v  

play05:00

you'll notice now this one's not quite right it's  not gross profit that should be in here so we'll  

play05:04

press the f2 key just to see what's going on and  you can see that we actually have to drag them a  

play05:08

bit lower down till the labor here press enter and  then control c again and control v and now it's  

play05:14

looking the way it should now that the assumptions  are looking good let's actually fill in the income  

play05:17

statement so go control up all the way to the  top and then for the gross revenue first that's  

play05:22

just going to be the price times the quantity so  we'll go equals go all the way to the assumptions  

play05:26

that's the cup sold times the average price per  cup press enter after at the discounts they're  

play05:32

going to be negative as we're essentially giving  away money in a way right so for that we'll go to  

play05:36

equals as we said it's a percentage of revenue so  we'll select the gross revenue and then multiply  

play05:41

it by minus the five percent so let's go ahead and  select that press enter and then for net revenue  

play05:46

we just consume these two so you can go the  shortcut for that is just the alt equals that's  

play05:51

going to automatically fill that and give you the  formula press enter moving on to raw materials and  

play05:56

here we're going to go equals and select the gross  revenue because it's a percentage of revenue again  

play06:01

and now this time around we want to press the  f4 key and then press the f4 key again till you  

play06:05

only have this dollar sign on this on the five if  you don't know these dollar signs essentially fix  

play06:10

a cell so if you move a formula along that cell  is going to remain fixed so that's what we want  

play06:14

for this one and then multiply it by the the raw  materials percentage which in this case is that 30  

play06:21

press enter and this way we actually want to make  it negative because it's going to be a cost right  

play06:25

so press the f2 key and at the very front of the  equal sign press the negative sign press enter  

play06:31

and then we'll just drag this drag this down  a bit so ctrl c and then just paste it down  

play06:35

over here like so and then for a total cogs  again same thing so alt equals press enter  

play06:41

i just noticed here that the formatting should  be a bit different actually so this one here  

play06:45

the total cogs should actually have that format  for the gross profit so for that we'll select  

play06:49

this over here press the alt h fp and then  just the down arrow that's going to give you  

play06:54

the same format for the one below and then this  one here we don't want this format we actually  

play06:58

want our normal format like the transaction fees  here so we'll select that by shift right arrow  

play07:03

and then alt hfp and then press the down arrow and  now that's looking better next up for the gross  

play07:08

profit here we're actually going to be equals  and that's going to be the net revenue plus  

play07:14

the total cogs here and you might be like well  isn't the cost a negative and it is but because  

play07:18

it's already a negative over here if we do a  negative minus another negative it's going to  

play07:22

be positive for us so instead we just sum on both  of them and that should be working for the gross  

play07:28

profit margin just below we want to go equals and  that's going to be the gross profit divided by the  

play07:34

revenue over here press enter now moving on  to the operating expenses and the first one  

play07:38

we've got is the labor here and again we want  to make it negative as it's going to be a cost  

play07:42

for us so equals negative sign control up all  the way to the gross revenue here and we want  

play07:47

to lock this one again so press the f4 key f4  key again so it's just on the number over here  

play07:52

and then multiply that by the percentage of labor  so control page down control down arrow sorry and  

play07:58

let's select this one here labor as a percentage  of revenue and same thing we want to control c  

play08:02

and just paste it down control v over here total  opex is going to be alt equal sign press enter  

play08:08

and then for the ebitda we'll go equals that's  going to be the gross profit plus the total opex  

play08:15

and in case you don't know what ebitda stands for  it's the earnings before the interest the tax the  

play08:20

appreciation and amortization you're probably  wondering what that means or why it's useful  

play08:25

and it's generally a measure of profitability and  the reason why you want something like this is to  

play08:29

be able to compare with other companies better for  example this is a bit of an extreme example well  

play08:33

let's say that one company pays zero and zero  dollars in tax and the r1 actually has a 30 tax  

play08:39

rate so you pay a ton in tax now those two aren't  very easily comparable if you're comparing the net  

play08:44

income of one versus the net income of the other  just because if that one's paying 30 tax rates  

play08:48

then that net income figure is obviously going  to suffer that's why you actually omit the tax  

play08:53

rates and you go to something like ebitda so you  can compare them more fairly next up here we've  

play08:57

got depreciation amortization and for now we'll  omit this we'll get back to it later on for the  

play09:02

ebit let's go ahead and set up the formula right  now so we'll go to equal sum press the tab key and  

play09:06

just select the two from here for the interest  expense we'll also meet up for now and get back  

play09:11

to it later but let's set up the formula already  so we'll go equal sum press the tab key and select  

play09:16

these two over here for taxes we do know them  they're the 21 assumption that we have below  

play09:21

so let's go ahead and do that so equals get the  ebt times the tax rate so ctrl down arrow all the  

play09:27

way to the bottom here the 21 percent press  enter but it should be a negative right for  

play09:31

attack so we'll go f2 key and put a negative sign  up front so press the f2 again sorry and just put  

play09:37

a negative here press enter for net income it's  just going to be the sum of that so equal sum  

play09:42

top key and select these two here lastly we have  the net income as a percentage of revenue so this  

play09:47

is just another ratio that we have so we'll  go equals net income divided by the revenue  

play09:53

so that's going to be the net revenue over here so  now that we've filled all the items for the income  

play09:58

statement we should be able to drag them along so  first press the control up to go all the way to  

play10:02

the top then the shift down arrow and just select  everything to the bottom here and then ctrl c  

play10:08

and then shift right shift right all the way  to the end and ctrl v that should automatically  

play10:12

populate for us and before we move on if you  like what you're seeing we do have an excel  

play10:17

for business and finance course which i created  with my friend michael who helped me with this and  

play10:21

he's a financial analyst at tesla in the course we  teach everything we know about excel specifically  

play10:27

for people either looking to break into the  industry or those in it trying to level up  

play10:31

their excel skills unlike most other theory-based  courses we try to make this one as practical as  

play10:35

possible based on our real experiences working  at companies like tesla amazon or goldman sachs  

play10:41

so aside from the typical lessons on formatting  formulas and charts we have case studies that  

play10:46

replicate the type of work you might be assigned  in your day to day ranging from financial modeling  

play10:51

to cleaning a data set and presenting some visual  insights related to this video we also have an  

play10:57

in-depth three statement model which goes over  apple's real financial statements so if you're  

play11:02

interested in checking it out we'll leave  the link in the description below alright  

play11:06

so we finished the income statement but we do have  some line items that are still not done like the  

play11:10

depreciation over here so for that let's go to the  very last tab which is the one on the fixed assets  

play11:15

so go to control page down all the way to the  last one from here this is going to help us fill  

play11:20

in the depreciation and amortization so firstly  let's clean up the formatting again over here a  

play11:24

bit so select all of this area here so ctrl shift  right arrow from there go to control one let's go  

play11:30

under custom again and we want to change this to  y y y y and then we'll put this reverse dash sign  

play11:36

and press the e press enter and that's going to  change it for us we also want to change a bit over  

play11:41

here put the indents and so on which i'm going  to fast forward so you don't have to see it all

play11:50

so to explain this table a bit better over here  we've got the different types of investments that  

play11:54

we expect to make so we're hoping to buy a lemon  crusher an ice machine and a refrigerator as well  

play12:00

that's going to be in 2022 and over here the asset  life we've consulted with the different vendors  

play12:05

and this is what they say we should estimate as  the life of the assets so basically how long till  

play12:10

we have to throw it away because it's no longer  useful to us so we've got the lemon crusher at  

play12:14

three years and then seven years for the other two  so we can go ahead and put the totals over here  

play12:18

so press the alt and arrow the equal sign press  enter ctrl c and just drag that cross control v  

play12:25

over here you'll notice that we actually buy  another lemon crusher in 2025 and that's because  

play12:29

it's only got a three year life and so it's  we're probably going to dispose of it by by  

play12:33

the end of this one so we buy a new one so  now that we know what we're buying we can go  

play12:36

ahead and create a depreciation schedule which is  going to be just down below and if you don't know  

play12:41

what depreciation is it's just a way to allocate  the cost of an asset over its useful life so for  

play12:46

example if you bought say a new truck for the  lemonade stand that costs 50 000 then all of a  

play12:51

sudden in the one year you would have a drop in 50  000 and you'd probably have a huge loss that year  

play12:56

but the next year things would be pretty good and  so that doesn't make much sense and instead what  

play13:00

you do is try to allocate it over its life let's  say the truck has a 10-year lifespan and so for  

play13:06

that you're going to incur the cost on a relative  basis so everything at five five thousand per year  

play13:11

as opposed to just having the 50 000 which looks  like something terrible happened one year and then  

play13:16

things are back to normal which is just a bit odd  if we look into the depreciation table over here  

play13:20

we can see that we have already some existing  equipment say from previous years for example  

play13:25

and on top of that we have what we're going to buy  so for the lemon crusher we need to allocate it  

play13:29

over his three-year life in this case so we'll  go to equals then we'll select the 5000 here  

play13:34

which is the cost press the f4 key such that it's  only locking the d sign and then divide that by  

play13:41

the number of years same thing we want to press  the f4 press it again and one last time press  

play13:46

enter from there if you love if we've locked the  things correctly we should be able to just drag  

play13:51

it down so ctrl c drag it down here and then ctrl  v let's just make sure by selecting this last one  

play13:57

pressing the f2 key like so and you can see that  it's moved on accordingly to the where to the  

play14:02

place that it should from there we'll select  all of them so firstly let's do the first one  

play14:06

so ctrl c and then drag it across to control v  you'll notice that because we buy a new one here  

play14:12

and it's only got a lifespan of three  years we actually need to renew it here  

play14:15

so we'll go to equals and then select this  one again press the f4 key f4 key again and  

play14:20

one last time and then divide that by by three  select here and then press the f4 key again  

play14:28

like so and then for these ones we can just drag  them across so control c and just press ctrl v  

play14:34

and we actually need to do this all the way  until the end so control c control v here and  

play14:39

lastly we need to sum everything so for that  we'll just go to alt equals press enter and  

play14:44

just drag that across press ctrl v so now that  we have the total depreciation amortization we  

play14:49

can already link that back to the income statement  so let's go ahead to the income statement control  

play14:53

page up all the way here and then for the first  one go to equals control page on to the last one  

play14:58

and we'll select the 2022 one press enter  from there we should be able to drag it along  

play15:03

but first we actually need to make it a negative  here so press the f2 key and let's put a minus  

play15:08

sign right here up front press enter and  then ctrl c just drag it across ctrl v  

play15:14

and in this case you might notice that we have a  depreciation and amortization if you don't know  

play15:18

the difference basically depreciation has to  do with tangible assets so things that you can  

play15:22

actually touch like say machinery a building  other things like that on the other hand for  

play15:27

amortization it has to do with the intangibles so  things that you can't touch examples of that are  

play15:31

usually like patents copyrights and other things  like that and the last line item that we have to  

play15:36

fill here in the income statement is the interest  expense and for that we're actually gonna start  

play15:41

getting into the balance sheet and then be able  to backtrack from there so go to control page down  

play15:46

so first things first let's work on the formatting  here so for that you see that we have a historical  

play15:50

number so that's going to be an actual as opposed  to an estimate like all of these here so to change  

play15:55

that we'll go to control one and then we'll go  to custom here and now we don't actually want  

play15:59

just the years but we also want the month because  it's going to be the balance sheet it's a snapshot  

play16:04

of a specific time period so for that we'll go  something like mmm press the dash key and then yy  

play16:10

which is going to be for the years and then we'll  put this sign over here and then put on a for the  

play16:15

actual press enter now we've got the december 2021  actual and for all of these we want to change them  

play16:21

to estimates same kind of concept control one key  we'll go to custom and we'll change those so 3ms  

play16:30

press the dash and then we'll go to year year  

play16:34

put the sign here and then we'll go for e for  estimate nice now we have to do all of the  

play16:39

other formatting stuff which we've done before  so i'm just going to fast forward this as well

play16:48

all right so now we have the formatting looking  the way that we like it let's go ahead and start  

play16:51

looking at the historical figures so we can  see what's going on so we had cash of 5000  

play16:56

next to that we have the accounts receivable of  150. if you don't know what accounts receivable  

play17:01

is this is typically when they paid for something  but you still didn't get the cash for example a  

play17:05

typical example here could be with the credit card  companies where there might be a bit of a delay  

play17:09

between when the customer actually pays and when  you get the money in under the fixed assets we've  

play17:14

got the 10 000 over here which as we mentioned is  for the existing equipment if we go control page  

play17:19

down to the fixed assets here you'll find that  we've got all of this existing equipment that  

play17:24

we mentioned earlier which is being depreciated so  control page up again to get over here this is the  

play17:28

accumulated depreciation of it so we can start  putting the totals in for these ones so we'll  

play17:33

go to alt equals here for the first ones and then  alt equals again for these press enter total long  

play17:39

current assets is just the the net fixed assets  press enter and then for the total asset is the  

play17:44

sum of the current plus the non-current so equals  this one the current assets plus the non-current  

play17:49

assets press enter then on the liabilities side  we've got the accounts payable so for example  

play17:54

maybe we bought some lemons from a vendor but we  still don't pay them in full that's why we might  

play17:59

have something like that next to that we have  deferred revenue so this is when we've already  

play18:03

received the revenue from a customer but we still  haven't delivered the product for example maybe  

play18:08

they've they've already booked in advance for a  lemonade and they paid us money for it already  

play18:12

that could be the case for the third revenue so  we'll go alt equals here and press enter for the  

play18:18

other liabilities we have some debt over here  that's mainly because they were a startup and  

play18:22

so we need to borrow some money from the bank to  get started so we'll go equals and then just link  

play18:27

it from here and for the total liabilities it's  a sum of the current and the non-current so this  

play18:32

one plus this one over here press enter next up  under equity we have the common stock which is 300  

play18:37

this can get a bit complicated but for now just  see it as your assets minus your liabilities so  

play18:42

whatever is left in your company after you sell  everything and you pay off for all your debts  

play18:46

and then lastly we've got the retained earnings so  that's whatever you have at the end of the year at  

play18:50

your company so let's get the sum of that too so  alt equals press enter and for total liabilities  

play18:55

plus equity same thing so equals total equity  plus the total liabilities and press enter and  

play19:01

the balance check here is basically going to check  if the assets equal the lap the liabilities plus  

play19:06

the shareholders equity if that's not the case  then we probably made a mistake somewhere so this  

play19:11

is some sort of a health check if you will you can  press the f2 key and that's how you see what there  

play19:15

is currently there moving on from that and we've  got all of the different assumptions over here  

play19:19

under down below here and so firstly we've  got the net revenue assumption as well as  

play19:23

the cogs assumption which are going to help us  calculate all of this stuff here for the accounts  

play19:28

receivable let's make this one dynamic again so  we'll go to equals and just select the accounts  

play19:32

receivable here and put the ampersand quotations  and then we say as a space as a percentage of rev  

play19:42

then close the quotations and then press enter  and we need to do the same thing here with the  

play19:46

accounts payable so we'll go equals and firstly  we'll select the accounts payable here ampere sign  

play19:52

and then we'll go quotations quotations as put the  space here as a percent of rev revenue and then  

play20:02

we'll close the quotations here press enter and  lastly for the deferred revenue this is actually  

play20:07

the same thing so we'll just copy this one and  paste it that should work for us one thing though  

play20:11

for the accounts payable this is usually linked to  the cost of goods sold as opposed to the revenue  

play20:16

so we'll have to change that so go inside it by  pressing the f2 key and we'll just change this to  

play20:21

cogs there we go once this is set up here let's  go ahead and add the net revenue and the cogs  

play20:27

which we can find from the income statement so  we'll go equals control page up the net revenue  

play20:32

is going to be this one here press enter and  then for the cogs we'll go equals page up again  

play20:38

and that's going to be the total cogs here you'll  notice that the formatting is all messed up so  

play20:44

we'll go to alt h fp and then just drag it down  here once we have that ready ctrl shift down and  

play20:50

then ctrl c so i ctrl c and just drag it across  control v one thing though for the cox here we  

play20:56

don't really want it as a negative number just  because we're going to be doing percentages from  

play21:00

there after so we'll go to f2 key and just put  a negative sign in front so it makes it positive  

play21:05

press enter and then just drag it along ctrl  c ctrl v here so let's go ahead and do all of  

play21:10

the different percentages that we need so for  the accounts receivable first we'll go equals  

play21:15

control up all the way to the accounts receivable  and then we'll divide that one by the net revenue  

play21:22

same thing here so accounts payable equals we'll  go select the accounts payable here it is and then  

play21:28

we'll divide that by the cogs in this case and  then for our last one the free revenue equals  

play21:36

here's the third revenue and we'll divide it  by the net revenue here press enter and once we  

play21:41

have these historical figures we can actually go  ahead and forecast them for the future we're just  

play21:45

going to link them to whatever they were in the  past for simplicity so we'll go equals and just  

play21:50

select this one then just press ctrl c shift down  arrow then shift to right and press press ctrl v  

play21:56

and based on these percentages over here you'll  notice that generally the accounts receivable  

play22:00

is lower than the accounts payable now is that a  good thing yes because that basically means that  

play22:05

you're taking a lot longer for you to pay  whatever you need to pay but customers are  

play22:09

paying you fairly quickly and so you're actually  going to have a good cash flow in that sense  

play22:13

and now that we have all of these assumptions we  can go ahead and put them in to the balance sheet  

play22:17

here so for the accounts receivable we'll just go  equals we want to select the 1 and multiply by the  

play22:23

net revenue press enter same thing goes with  the accounts payable so equals control down here  

play22:31

accounts payable is this one and multiply that by  the cogs instead press enter and then same thing  

play22:37

for the last one the deferred revenue control down  arrow select this multiply it by the net revenue  

play22:44

and press enter now we can already get the totals  for these so let's just set up the formula you see  

play22:48

that the formula is already in here so just ctrl  c and then ctrl v to paste it along same thing  

play22:54

over here so ctrl c and then ctrl v to paste it  along and we can paste all these figures as well  

play23:00

so just ctrl v you'll notice that all of these  are sort of unformatted we'll press the ctrl 1 key  

play23:06

and from there we want to go under the numbers tab  and change the decimal places to to zero say press  

play23:11

enter now that's looking a lot cleaner uh these  over here let's also drag these across so ctrl v  

play23:17

now let's look into the non-current assets  that we have over here so for the fixed assets  

play23:20

this is basically going to be whatever fixed  assets that we had in the previous year and add  

play23:25

anything new to that so for that we'll go equals  select this one here and then plus control page  

play23:30

down all the way to the fixed asset side here and  we want to select the copics over here which is  

play23:35

our capital expenditures so whatever we've added  into the balance sheet in this case we press enter  

play23:40

and we can also move that across and then ctrl  v for the accumulated depreciation the concept  

play23:46

is pretty much the same except that it's going  to be negative right so we'll go equals select  

play23:50

whatever we had previously that's been accumulated  and another minus sign control page down page down  

play23:56

again and it's going to be total dna here press  enter then we can drag that across as well ctrl v  

play24:03

then the net fixed assets is going to be just the  sum of those so ctrl c we'll just drag it across  

play24:08

because we already have the formula and same thing  over here same thing with these two so ctrl c  

play24:14

and then ctrl v because we just need to drag  them across and total long current assets here  

play24:18

should have a bold so we'll press the shift  space key to select the row and then ctrl b  

play24:24

there we go now moving on to that area that we  have over here and for this we actually have  

play24:29

different assumptions so let's look at them down  below here here we've got all of the different  

play24:33

information that we're going to need so right now  you can see that we're going to need to borrow  

play24:36

some money in this particular year but anything  before that we're just going to be repaying  

play24:41

whatever we had so remember we took out a loan  over here that you can find of say 10 000 and so  

play24:46

that's basically paying that down and as you can  see once we incur a new loan then obviously the  

play24:51

debt repayment is going to be higher usually the  debt is broken down into short-term and long-term  

play24:55

debt but for this case just to simplify it we just  put it all into one so going back to the balance  

play25:00

sheet item that's the debt here what we want to  do is first go to equals we're going to have the  

play25:06

previous year's debt plus any new debt that we've  incurred which is going to be the net borrowing  

play25:11

here minus any debt repayment or whatever we've  paid back of it so we'll select this one and  

play25:16

then press enter then we can just drag it across  so ctrl c ctrl v here and for this we can just  

play25:23

select these formulas ctrl c and then ctrl v then  for the equity side we've got the common stock  

play25:29

which we'll just assume is the same so go equals  and select this one press enter and then we've  

play25:33

also got the retained earnings so for the retained  earnings it's usually the previous year's balance  

play25:38

plus whatever net income that you made this  current year say so go to page up under the  

play25:42

income statement you'll find the net income over  here at the bottom and then press enter sometimes  

play25:48

you will have dividends which are going to be a  negative right because the money is going to be  

play25:51

going out to say the investors for example but in  our case we don't have that just for simplicity  

play25:56

then for a total equity it's just going to be  the same formula so ctrl c and then ctrl v drag  

play26:01

that across same thing here ctrl c and ctrl  v now moving on to the last assumption that  

play26:07

we have here under the balance sheet which is  the interest payment this is going to be useful  

play26:10

for us under the income statement to fill in this  last item which is the interest expense here so go  

play26:15

to control page down again and what we're going  to do is go to equals it's just going to be the  

play26:20

interest rate times whatever that amount that we  have which is this one over here press enter and  

play26:25

then we'll just drag that across ctrl v then go  to control page up and for the interest expense  

play26:31

we need to be negative so we'll go equals  minus control page down and we'll select it  

play26:37

from down here as the interest payment press enter  ctrl c drag it across control v we finally have  

play26:42

a complete income statement but now if you go to  control page down and check out the balance sheet  

play26:46

you'll notice that it's actually not matching for  all of these years over here which is obviously  

play26:51

not a good sign it should always match or else  we have a mistake but go to escape here and  

play26:55

then you'll notice that we actually don't have  the cash over here so that's probably why it's  

play26:59

currently not matching to find out the cash we're  actually going to create the cash flow statement  

play27:03

which you'll find just going by going to control  page down again so first things first let's format  

play27:08

this one quickly and i'm just going to fast  forward this so you don't have to see it again

play27:16

all right so now that we have it formatted the  way we like it firstly let's go ahead and get the  

play27:20

net income so for this we just got to go to the  income statement under the last line so equals  

play27:25

control page down all the way to income statement  then control down arrow to get the bottom and  

play27:30

we'll just select the net income here and  for the operating activities firstly we've  

play27:34

got the depreciation so for this one we'll  go to equals under fixed assets in this case  

play27:40

go over here and that's a total dna here press  enter and you might wonder why depreciation is  

play27:46

actually being added back here that's because  there's not really a real cash outflow in the  

play27:50

sense that whatever is a transaction you had with  the vendor let's say for a truck you already paid  

play27:55

for on that day and so that's why there's not  really a cash outflow now next up we've got the  

play28:00

change in accounts receivable so for that it goes  to equals we'll go to the balance sheet this is  

play28:05

going to be the current year's accounts receivable  minus the last years so go to control page down  

play28:10

start page up here and we'll select the  current years minus the previous years  

play28:18

press enter and now we actually have to make  this negative so for that we'll just go in  

play28:22

f2 and go to put a minus sign first and then  put it in brackets and get to the very end and  

play28:30

close the brackets here press enter and you might  wonder why an increase in accounts receivable is  

play28:35

actually something that should be negative that's  because when you think about it in terms of cash  

play28:39

the cash inflows are actually going down in that  more and more people owe you money but they still  

play28:44

haven't paid you that's essentially what accounts  receivables are and so for that it's actually a  

play28:48

cash outflow for us so it's a negative and for  the change in accounts payable it's pretty much  

play28:53

the same logic except that this time around  is flipped so we'll go equals control page up  

play28:59

get the accounts payable from here minus the one  just prior because we want the change press enter  

play29:06

and that should give you 20. and then we can just  drag this down ctrl c and ctrl v and to explain  

play29:11

this for the accounts payable side this basically  means that it's taking us longer and longer  

play29:15

to pay the cash say to a vendor for instance and  so we're keeping all that cash that's why it's a  

play29:19

positive thing for us that's why we have a cash  inflow with all this we can sum the operating  

play29:24

cash flows so alt equals press enter then we've  got the investing activities so these are usually  

play29:29

things like property plant and equipment that  kind of stuff that you might invest in in our  

play29:33

case we've got the capex so for that we'll go  to control page down to the fixed assets here  

play29:37

and we want to select the total capex over here so  the control page up go to equals and we want it to  

play29:43

be a negative essentially because we're spending  money to acquire say a specific machinery and  

play29:48

so it's a negative it's a cash outflow for us so  minus control page down and we'll go to the total  

play29:53

capex here press enter and then for the investing  cash flow it's just going to be a link to that so  

play29:58

this is it and then for the financing activities  we've got the debt repayments and the borrowings  

play30:04

both of these line items we can actually find  from the balance sheet so for the first one  

play30:08

for that repayment we'll go equals control page  up and we should be able to find it over here

play30:16

so here it is and in this case we it's actually  going to be a negative and when you think about  

play30:20

it we're essentially using our cache to pay down  debt and so it's a cash outflow for us so we'll  

play30:25

go to f2 key and put the negative sign in front  press enter and for the borrowings it's actually  

play30:30

the opposite when we borrow money we essentially  get cash and so that's good for us it's a cash  

play30:35

inflow so we'll go equals control page up and the  net borrowing should be right here press enter and  

play30:43

now for the financing cash flow which is the sum  of these two so sum and select two press enter and  

play30:49

the net cash flow is going to be the sum of all  of them so we'll go equals the net income plus  

play30:55

the operating cash flow plus the investing cash  flow plus the financing cash flow press enter  

play31:01

once we have that we want to select all of them  and then press ctrl c and just drag across by  

play31:06

pressing the shift and right arrow ctrl v once we  have the net cash flow we can actually go ahead  

play31:11

and fill in the balance sheet where we're missing  the cache if you remember over here we're missing  

play31:15

it and so that's why it's currently giving us  a negative balance on the check here so let's  

play31:21

go ahead and link it so we'll go to equals we  actually need to do the previous years so this  

play31:25

cache over here and add whatever change there  was the cash flow which we figured out in the  

play31:30

statement of cash flows here and then press enter  and from there we'll select all of them so ctrl c  

play31:36

and then shift right arrow ctrl v now if we did  this correctly once we checked the balance in  

play31:41

the balance check here it should be zero that  would mean that we've done everything right  

play31:46

so we'll go ctrl down arrow all the way  here and you can see that they're all  

play31:50

they're all zero sorry so basically  means that we did everything correctly  

play31:54

so creating a dynamic three statement model  like the one we created here is going to be  

play31:57

the foundation for any sort of valuation that you  might want to do on top of that for example it  

play32:02

could be a discounted cash flow a leveraged buyout  a m a model other things like that so if you want  

play32:07

to learn more about valuation you can check out  this video over here or if you're interested in  

play32:12

knowing how to make this a bit more visually  pleasing with some cool excel charts check out  

play32:16

this other video over here that's all for this  one hit the like hit that subscribe and comment  

play32:21

down below it helps out the algorithm that's all  for this one and i'll catch you in the next one

Rate This

5.0 / 5 (0 votes)

相关标签
Financial ModelingExcel TutorialIncome StatementBalance SheetCash FlowValuation WorkDepreciationAmortizationCapital ExpenditureBusiness AnalysisStart-up FinanceInvestment Planning
您是否需要英文摘要?