Master Institutional Supply and Demand Trading (ULTIMATE STRATEGY GUIDE)
Summary
TLDRThis video script delves into the art of mastering supply and demand for trading success. It reveals crucial insights into institutional order flow, explaining how to identify high-probability trading zones and enter and exit trades for maximum profit. The script dispels common myths about price movement, emphasizing the herd mentality of traders and the importance of recognizing patterns in market order flow. It also outlines methods for drawing supply and demand zones and stresses the significance of aligning with institutional trading flows for consistent profits.
Takeaways
- 📈 Understanding Supply and Demand: The video emphasizes the importance of mastering supply and demand to trade alongside large institutions and achieve consistent profits.
- 📊 Reading Institutional Order Flow: Learning to read institutional order flow is crucial for identifying high-probability trading zones and making informed trading decisions.
- 🔍 Identifying Zones: The script explains how to mechanically draw supply and demand zones and find areas with a high likelihood of institutional trading activity.
- 📉 Herd Mentality in Trading: The collective behavior of millions of traders can create a herd mentality, which can be identified on price charts and exploited for profit.
- 🤑 Market Manipulation: The financial markets are often manipulated, with heavy order blocks on both bid and ask sides, affecting the natural supply and demand balance.
- 🛍️ Two Types of Orders: The distinction between passive limit orders and aggressive market orders is key to understanding how markets move and how order flow is created.
- 📊 Order Book Dynamics: The script describes the order book, showing bids and offers, and how trades occur when buyers and sellers agree on a price.
- 🚀 Imbalance and Price Movement: Large institutional orders can cause rapid price movements due to the imbalance between supply and demand, which can be tracked on price charts.
- 🔄 Market Cycles: The market operates in cycles, with order flow continuing in one direction until an overwhelming imbalance forces a shift, seeking new liquidity to rebalance prices.
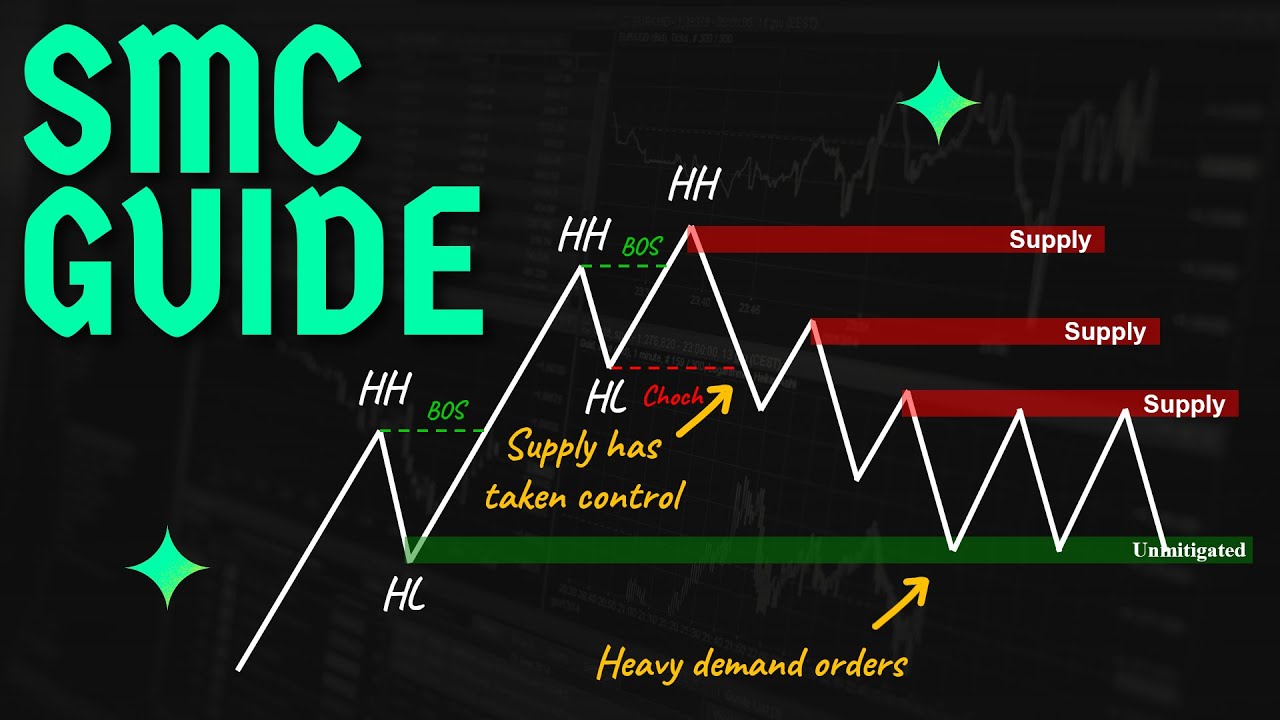
- 📝 Drawing Zones Consistently: The video outlines methods for consistently drawing supply and demand zones, including range, pivot, and fractal zones, to identify pivot points in price.
- 🎯 High-Probability Trading: The script provides criteria for identifying institutional supply and demand zones, including factors like structure breaks, flip zones, and available liquidity.
Q & A
What is the main focus of the video on institutional supply and demand?
-The video focuses on explaining what institutional supply and demand is, how to read institutional order flow, how to draw supply and demand zones, and how to trade with high probability zones for consistent profits.
Why do traders often exhibit a herd mentality in the markets?
-Traders exhibit a herd mentality due to the emotional nature of trading, which is driven by fear, greed, and uncertainty. When millions of traders come together, their collective behavior can create patterns on price charts that can be exploited for profit.
How does the market operate in terms of supply and demand for currency exchange rates?
-The market operates as a continuous auction where buyers and sellers compete to get the best possible price. Buyers bring demand, applying upward pressure on prices, while sellers bring supply, applying downward pressure.
What is the difference between passive and aggressive orders in the market?
-Passive orders are limit orders that wait for the market to reach a certain price, while aggressive orders are traded at the current market price without waiting for the market to come to them, often crossing the spread to execute.
Why can't large institutions hide their order flow in the market?
-Large institutions cannot hide their order flow because their trades create significant imbalances in the market, which are visible as footprints on price charts. This allows traders to spot their activity and trade with their order flow.
What is the significance of supply and demand zones in trading?
-Supply and demand zones are areas on a price chart where orders are accumulated or distributed. They are significant because they indicate high probability areas for price movements and can be used to enter and exit trades with better risk-reward ratios.
How can a trader identify a high probability institutional demand zone?
-A trader can identify a high probability institutional demand zone by looking for zones that led to a break of structure, are flip zones, have sweep and inducement characteristics, are stacked with higher time frame zones, have alignment with higher time frames, are well-priced, and are unmitigated.
What are the three main methods for trading from supply and demand zones?
-The three main methods are setting a limit order directly on the zone, waiting for a reversal candlestick formation at the zone combined with a liquidation, or using a lower time frame break of structure for more confirmation and increased risk to reward.
Why is the fixed R method recommended for trade management?
-The fixed R method is recommended because it targets the same amount of profit for each trade, which is a set and forget approach that minimizes emotions and helps keep the odds in the trader's favor in a probabilities game.
What is the importance of understanding multi-time frame analysis in trading?
-Understanding multi-time frame analysis is important because it helps avoid losses by recognizing the power of time and the influence of higher time frames, which usually take precedence over lower time frames in market movements.
Outlines
📈 Understanding Institutional Supply and Demand
This paragraph introduces the concept of supply and demand in trading, emphasizing its importance for institutional trading strategies. It explains how the market functions like a continuous auction with buyers and sellers competing for the best price. The video promises to reveal critical insights into institutional supply and demand zones, which are vital for identifying high-probability trading opportunities. It also dispels common misconceptions about price movement and highlights the role of order flow in creating price action patterns that can be used for forecasting future price movements.
📊 The Dynamics of Market Imbalance and Liquidity
The second paragraph delves into the dynamics of market imbalances, explaining how aggressive buyers and sellers impact price movements until a new equilibrium is found. It discusses the concept of supply and demand zones within trading ranges and how these zones can lead to breakouts as the market seeks new liquidity. The paragraph also explains the importance of identifying and trading in continuation patterns, which follow the initial breakout and represent high-probability trades aligned with institutional order flow.
📚 Mastering the Art of Drawing Supply and Demand Zones
This paragraph focuses on the technical aspect of identifying and drawing supply and demand zones on price charts. It outlines three types of zones: range, pivot, and fractal zones, each with its criteria and methods of identification. The paragraph also emphasizes the importance of finding a balance between refinement and practicality when drawing zones to maximize accuracy and risk-reward ratios while minimizing the risk of false signals.
🔍 Identifying High-Probability Institutional Zones
The fourth paragraph provides a detailed guide on how to identify high-probability institutional supply and demand zones. It lists eight key criteria that must be met for a zone to be considered institutional, including structural breaks, flip zones, sweep zones, inducement, zone stacking, time frame alignment, well-priced zones, and untouched zones. The paragraph stresses the importance of confluence among these criteria to increase the probability of successful trades.
Mindmap
Keywords
💡Supply and Demand
💡Institutional Order Flow
💡Price Action
💡Liquidity
💡Order Book
💡Passive and Aggressive Orders
💡Pivot Zones
💡Range Zones
💡Fractal Zones
💡Risk-Reward Ratio
💡Fixed R Method
Highlights
Mastering supply and demand is crucial for trading with large institutions and achieving consistent profits.
Price moves due to herd mentality in trading, influenced by emotions like fear and greed.
Order flow, driven by market participants' behavior, is what creates price action on charts.
Institutions cannot hide their order flow, which can be identified to trade profitably.
Currency exchange rates are determined by the agreement of buyers and sellers on a price.
Markets operate as continuous two-way auctions with bids and offers visualized on order books.
Understanding the difference between passive limit orders and aggressive market orders is key to grasping market dynamics.
Large institutional orders can cause rapid price movements as they absorb available supply or demand.
Supply and demand zones can be identified in sideways price movements within a range.
Price breakouts from ranges signal an imbalance between supply and demand, creating high-probability trading opportunities.
Traders should wait for price to return to a zone before entering trades to maximize risk-reward.
Supply and demand zones can be mechanically drawn using range, pivot, and fractal methods.
Certain criteria must be met for a zone to be considered an institutional supply and demand zone, including its impact on market structure.
Multi-time frame analysis helps in avoiding losses by confirming trends and potential reversals.
Fixed R method for trade management is recommended for consistent profitability.
The importance of identifying fresh zones that haven't been touched by the market for stronger trading signals.
Combining multiple confluences increases the probability of successful trades from identified zones.
Three main methods for trading from supply and demand zones include limit orders, reversal patterns, and lower time frame confirmations.
Transcripts
if you can Master supply and demand you
will be able to trade with the large
institutions find big risk for all
trades and Bank consistent profits in
this video I'm going to share some vital
points about institutional Supply
demands that most people simply don't
know and it's these critical points that
have now helped countless of our members
get funded and Bank their first ever
profit splits this video explains what
is supply and demand how to read
institutional order flow how to
mechanically draw the zones how to find
high probability institutional zones and
I'm going to drop some serious source
for you here and finally how to enter
and exit for maximum profit but first to
take advantage of the market you must
understand the true reasons as to why
price moves does the price fall from
here to there because there are more
sellers than buyers nope this is wrong
keep watching to find the truth now as
history has repeatedly shown Traders are
often a very emotionally charged group
when millions of them get together in a
highly emotional money game of fear
greed and uncertainty their combined
Behavior takes on a herd mentality and
we can spot this on our price charts and
make money from it how well you've got
millions of Market participants putting
millions of orders through the market
for a million different reasons all of
this behavior and participation is what
drives the order flow that is put
through the market and that order flow
is what prints price action on our
charts and that price action creates
patterns these patterns repeat
themselves over and over time and time
again and that allows us to make high
probability forecasts of where price may
move in the future because when those
big institutions enter trades they
cannot hide their order flow and we can
spot their footprints in the market if
you know what to look for let me explain
currency exchange rates move up and down
as a result of supply and demand from
Market speculators no trades can take
place unless both the buyer and the
seller agree on a price so this drives
the price of currency pairs where buyers
bring with them demand for the pair
applying that upward pressure on prices
while sellers bring Supply applying
downward pressure on prices the market
runs like a continuous auction
throughout the day with buyers and
sellers competing with each other to get
the best possible price now in a perfect
and free market this would be quite a
smooth and fair process but in the final
financial markets this is often a heavy
manipulated process let me explain
markets work in two-way auctions both
buy and sell sides of liquid instruments
or have blocks of orders on both the bid
and the offers we can see this
visualized on the order book on the left
hand side you can see all of the bids
from the buyers and this shows how much
volume is demanded at each price level
and then on the right hand side you can
see all of the offers from the sellers
as this is also called the ask price and
this shows how much volume is supplied
at each price level and the more volume
that there is at each price level the
more liquid the market is think of it
like an auction house or Ebay where if
you are the buyer then you are making
bids for it and you either sell it it's
the price you're offering it or the
price you're asking for someone to pay
for it now remember a trade can only
take place if both the buyer and the
seller agree on a price so to execute an
order it must be paired with an opposite
order of equal size for example so sell
10 Lots there must be a buyer willing to
buy them at the ask price and vice versa
this is how the markets move now what
most people don't know is that there are
two types of orders where both buyers
and sellers can be passive or aggressive
passive Traders use limit orders and
they are waiting for price to hit them
so all of these orders that you see on
the bid and the ask they are limit
orders so if they were only passive
orders then the market wouldn't move
because all of those orders are waiting
to be hit so this is where aggressive
orders come into play aggressive buyers
and sellers they are trading at the
current market price and they are not
waiting for the market to come to them
but to do that they have to cross the
spread to buy at the ask price or cross
the spread to sell at the bid price most
execution platforms look like this where
you buy on the right hand side as that
is the current ask price and you must
cross that spread to be an aggressive
buyer and if you want to sell then you
must cross the spread to the left to hit
the bid and it's this interplay between
passive and aggressive orders is what we
call order flow so let's take a look at
a very oversimplified example of what
can happen on the order book in a live
market imagine this was the order book
for euro dollar and a large institution
wants to buy 10 000 Lots at Market so
this is an aggressive order they have to
buy 10 000 Lots at the best ask price
but as you can see there are only 103
lots available for sale at that current
ask price so the price will rapidly
shoot up as it instantly absorbs all of
the supply at each level until all 10
000 lots have been filled at 1.1539 due
to that huge imbalance between supply
and demand and now the market is sitting
at what is deemed to be fair value
between buyers and sellers so price has
to keep moving up to search for enough
liquidity to fill the order institutions
cannot hide those huge imbalances that
they cause in the market so if you know
how to spot their footprints on a chart
then you can trade with their order flow
rather than getting smashed against it
so what does this look like on a
Candlestick chart here you can see price
impulsively moving to the upside as
aggressive buyers keep pushing price
higher and higher until they find enough
Supply to fill their demand and price is
then rebalanced likewise here you can
see aggressive sellers liquidating all
of these bids pushing the price lower
and lower until they have consumed
enough demand to fill their supply and
this is how markets move when there is
an overwhelming imbalance between supply
and demand price will keep moving to
search for new liquidity to rebound its
price and this is happening every single
second that the markets are open now
obviously you and me were not quite
trading at the size big enough yet to
move those big liquid markets so how do
we make sure that we are trading on the
right side of that institutional order
flow and that's where supply and demand
zones come into play but how do we
identify these zones when prices moving
sideways in a Range this is where orders
are being accumulated or distributed as
price moves into the bottom half of the
range this is where buyers step in to
buy at discount cheap prices and then as
price moves into the top half of the
range sellers step in to short at
premium expensive prices you want to buy
low and sell high right pretty simple
eventually aggressive buyers will cause
an overwhelming imbalance between Supply
on demand and this is where price will
rapidly break out the range to the
upside to search for more liquidity to
absorb the demand and this is what
creates those demand zones now we don't
trade the initial breakout as this is
where losing Traders fomo into long
positions and they buy the highs instead
we wait for price to return to that zone
and then we look for our entry models to
get long as this is where the wrist
reward will be on our side and we are
buying where the institutions will be
now why does price return to the zone
and then continue from there well at
this level there is not enough demand to
keep pushing price higher so we wait for
price to return to the demand Zone where
there is previous institutional buyers
they will have a vested interest to make
sure that price does not trade any lower
and they keep their initial long
positions in profit and it's also likely
that they did not get filled on all of
their original position so they will
want to get along with their remaining
orders at these discounted prices
because remember they're going to want
to buy as cheaply as possible now there
are some other theories but we won't get
into those in this video and the exact
opposite happens in the creation of
Supply zones where prices in a Range
sellers will then cause an overwhelming
imbalance between supply and demand as
price will rapidly break up to the
downside but again we will wait for
price to pull back to that Supply Zone
to then look for potential shorting
opportunities and it's a four-step
process where we have the range the
initiation the mitigation and the
continuation and it's that continuation
is what we are looking to trade in line
with the institutional order flow this
is the cycle and heartbeat of the market
where order flow will continue in One
Direction until there is an overwhelming
imbalance between supply and demand in
the opposite direction price is
constantly seeking liquidity to
rebalance price so here you can see
price rapidly initiates out of the range
to the downside creating a supply Zone
it's likely this was backed by
institutional involvement price then
pulls back to mitigate the supply Zone
where we can look to get short to catch
the continuation you can see the sustain
bearish order flow as Supply is clearly
in control but markets are obviously
don't move in One Direction Forever
eventually the market moves low enough
to discount prices where demand then
comes into the market to overpower
Supply then we see the sustained bullish
order flow and institutions will defend
the last levels that they entered at to
keep their running positions in profit
the highest probability trades will
always be in line with autoflow so just
don't bother trying to fight it so how
do we mechanically draw supply and
demand zones in the same way every
single time there are three types of
supply and demand zones the first two
are the ones that I recommend you use
these are range and pivot zones the
names are pretty self-explanatory a
range created zone is where price
clearly initiates out of a range of
candles you draw the Zone from the top
to the bottom of the range a pivot zone
is where there is a pivot in price
caused by only one or two candles you
can draw this from the single candle
that is engulfed or you can include the
second candle too depending on how
refined you want to be for a supply Zone
it's usually a bullish candle where the
next thrust candle closes below its low
this can be called a buy to sell zone
for demand it's usually a bearish candle
where the next thrust candle closes
above its high and this can be called a
cell to buy zone now I'm not personally
that strict on the cell to buy or buy to
sell method because sometimes I will
draw a demand Zone on a Buddhist candle
that's then engulfed by another bullish
candle and vice versa because I'm just
looking for those pivot Points in price
you know where price has sort of paused
and is moving sideways and then price
clearly initiates out the range but for
a demand Zone that thrust candle must
close above the previous candle's high
and for a supply Zone the thrust candle
must close below the previous candles
low for it to be a valid Supply Zone and
you can see how a range Zone can be
refined to a pivot zone or even a
fractal Zone which is just the wick
however more refinement does lead to
increased accuracy giving you that
smaller stop loss which in turn gives
you that higher risk reward but it does
increase the probability of more
mistrates as price might not tag you
into the position once enough orders
have been filled find a consistent
balance that works for you and stick to
it so your Edge can play out in the long
run you know don't be chopping and
changing just because you feel like it I
recommend that you start with always
looking to take the single candle pivot
as this gives the best balance between
risk's reward and also getting entered
into enough positions now remember that
the market is made up of all of those
orders transacting with each other but
we make sense of that complicated order
flow with our Candlestick charts if you
see a range Creator Zone on one time
frame this will be a pivot Zone on a
higher time frame so if you see this
range Creator Zone on let's say the one
hour chart the zone is made up of four
candles but if you go up to the four
hour chart what do you think that zone
is going to look like you guessed it it
will be a single candle four hour pivot
Zone because for one hour candles are
going to make up one for our candle so
when you truly understand the fractal
nature of markets you don't even need to
change time frames to be able to
visualize what price action will look
like on that other time frame so that's
why a lower time frame range will be a
higher time frame pivot Zone and vice
versa here are three types of fractal
supply and demand zones the first is an
inside bar this is when a candle fails
to break the previous candles high and
low and it trades inside of it inside
bars are a range on a lower time frame
the second type of fractal zone is sell
to buy or buy to sell wixoms foreign
when price is bullish and moving to the
upside it looks like there isn't a
demand Zone because price doesn't form a
pullback on that time frame but those
Wicks represent a pullback on a lower
time frame as you can see price moves to
the upside then it pulls back as the
next candle starts to form and then
pushes up again so if you were to look
down on the lower time frame this will
be a lower time frame pivot or range
created demand and the exact opposite
happens for buy to sell Wick zones which
represent lower time frame Supply the
third type of fractal zone is where you
have a very large width and instead of
drawing the big pivot Zone you can
refine it to just the wick of the candle
as this will be a lower time frame pivot
or range zone now as all of those are
fractal refinements they are simply a
way of looking at lower time frame zones
on your time frame so I would actually
recommend that you kind of ignore those
for now and you just concentrate on the
pivot and range zones on that same time
frame that you're looking at because
those will contain the most orders and
therefore should give you those higher
probability moves now obviously not all
Supply demand zones are created equal
there are very specific criteria that
must be met for it to be an
Institutional supply and demand Zone
there are eight key areas for us to
focus on and the first is whether the
Zone led to a break of structure this is
the simplest and most effective filter
that you can use it takes a ton of money
to break structure on a liquid
instrument and the more significant that
the structure it breaks the more
significant The Zone swing structure is
stronger than internal which is stronger
than fractal so zones that cause a break
of spring structure they're going to be
the most likely ones to cause the next
break of Swing structure here you can
see this demand Zone broke the daily
swing high so then when price returns to
Zone there is enough demand within there
to break the neck swing High number two
is if it is a flip zone now the key here
is that you must see that interaction
between supply and demand until one
overpowers the other here you can see
supplier was in control but when price
returns to it Supply tries to make a
lower low but it fails to do its job
because huge demand steps into the
market to overpower it that pattern that
shows us that supply has now flipped to
demand and this is a high probability
area for us to get lots but remember you
must see that interaction first for it
to be valid number three are sweep zones
these are zones where liquidity is swept
and taken as they are created but why is
this important well remember
institutions need opposing liquidity for
them to trade against so that they can
get minimal slippage when they enter and
exit the market so if they're buying
they need a lot of Supply to buy against
there will be a lot of sell orders below
this low and that's generated from
people's stop losses from early buyers
and then breakout traders who are trying
to sell that low but the institutions
know this and they will use that cell
size liquidity behind that low in order
to get long so if you see a sweep Zone
this signals it was created with
institutional involvement number four is
inducement and this is another liquidity
concept that can get very technical but
essentially you just want to see is
there available liquidity in front of
the zone why well same reason as before
institutions are going to need need that
opposing liquidity to enter the market
with minimal slippage here you can see
there is available liquidity behind this
low for institutions to use to buy
against but if there isn't any available
liquidity then very often these zones
are trapped and they will usually fail
here you can see that there is
absolutely no available liquidity in the
leg so this is a very obvious trap as
institutions will not be selling it
number five is the Zone stacked with
another higher time frame Zone the more
you can stack zones across time frames
the more orders there should be in that
area increasing the probability of the
move number six do you have alignment
with the higher time frames because the
more time frames that you have aligned
the higher probability of that trade
here it might look like a high
probability cell to follow the bearish
trend on the M5 but the M15 is bullish
and it's just mitigated the M15 demand
at the strong M15 low so now the M5 is
likely to also switch bullish
understanding multi-time frame analysis
will help you to avoid a ton of losses
as time is power and higher time frame
will usually win number seven is The
Zone well priced generally the highest
probable demand zones will be buying in
discount prices which is in the bottom
50 of the range or selling premium
prices in the top 50 of the range this
also improves your risk rewards because
we want to buy low and sell high right
and last but not least number eight is
the Zone unmiticated it's just a fancy
way of saying is the Zone completely
fresh or has it already been touched
because if you see a Zone with touches
then it's very likely that a lot of the
resting orders within that zone have
already been filled so I try to focus on
zones that are completely fresh as these
usually give the strongest move when
price mitigates them now combining as
many of those confluences together are
going to give you the highest probable
institutional demand zones to trade from
so now you know how to identify high
probability zones how do you actually
trade from them well there are countless
ways but here are three main methods the
first one is just simply setting a limit
order directly on the Zone the second is
to wait for a reversal Candlestick
formation at the Zone but this is best
combined lined with a liquidation too or
finally you can use a lower time frame
break of structure for more confirmation
and increase risk to reward we will
cover entry models in Far More depth in
a later video so make sure you subscribe
so you don't miss that but before you're
even going to enter a trade you should
know exactly how and where you're going
to exit now I could do a whole series on
just train management alone but in my
opinion if you want to get consistently
profitable as soon as possible my
recommendation is to always use the
fixed R method so this is where you
always Target the same amount such as 3r
for example it's a set and forget
approach that helps to keep emotions
very low as you're not chopping and
changing between arbitrary technical
targets at the end of the day trading is
purely a probabilities game and the
fixed our method just helps to put the
numbers in your favor now watch this
next video in the series to see a full
walkthrough of how we trade
institutional zones in depth and if it
isn't live to share make sure you hit
that subscribe button so you don't miss
it
浏览更多相关视频
Master Liquidity Concepts (Mechanical Strategy)
Ultimate Smart Money Trading Guide
Master Supply & Demand Trading (ULTIMATE In-Depth Guide)
The Concept of Order Blocks - Smart Money Trading
This Supply & Demand Strategy Will Make You 10X Better As A Beginner
The Best Order Block for Entering Profitable Trades in Smart Money trading technique.
5.0 / 5 (0 votes)