Elliott Wave Part 1 || Tools untuk membantu Counting
Summary
TLDRThis video provides a comprehensive introduction to basic trading concepts using Elliott Wave theory and Fibonacci tools. It explains how to identify impulsive and corrective waves, define key points like the zero point and invalidation levels, and use trend and momentum indicators for objective analysis. The content emphasizes understanding wave structure, trend continuation, and proper channel usage, while cautioning against assuming reversals too early. Practical guidance is given on identifying divergences, extended wave counts, and confirming trends, making it a useful resource for traders seeking to strengthen technical analysis skills and improve trading decision-making.
Takeaways
- 😀 The video focuses on basic science concepts related to Elliott Wave Theory and Fibonacci tools in trading analysis.
- 😀 Fibonacci retracements, extensions, and other related tools are essential for analyzing market trends and corrections.
- 😀 Impulsive waves are identified by a strong directional movement, often around a 45° angle, and require confirmation via indicators.
- 😀 Corrective waves move against the main trend but do not always indicate a reversal; they can be simple or complex patterns.
- 😀 The starting point for analyzing an impulsive wave is the 'zero point,' which may not always correspond to the lowest price but the start of momentum.
- 😀 Indicators like EMA, Ichimoku, and oscillators are used to objectively confirm trends and momentum alongside Fibonacci tools.
- 😀 Counting impulsive and corrective waves accurately is crucial, and impulsive waves may extend beyond the classic 5-wave structure in certain cases.
- 😀 Invalidation levels help identify if an impulsive wave has failed, providing traders with risk management cues.
- -
- 😀 Divergences are observed at the end of impulsive waves to anticipate potential trend exhaustion or reversal points.
- 😀 Channels and trendlines assist in visualizing the continuation or completion of impulsive and corrective waves, supporting better trading decisions.
Q & A
What is the primary focus of the video content?
-The video focuses on basic science concepts related to trading analysis, particularly using Fibonacci tools, trend analysis, and web impulsive/corrective patterns in market movements.
Which Fibonacci tools are emphasized in the video?
-The video emphasizes several Fibonacci tools, including Fibonacci retracement, Fibonacci extension, and other variations necessary for analyzing market trends.
How does the video define the starting point or 'zero point' in trend analysis?
-The zero point is defined as the starting point of momentum in an impulsive move, which is not always the lowest price but often a point of rejection that signals the beginning of a trend.
What role do indicators like Ichimoku and EMA play according to the video?
-Indicators such as Ichimoku and EMA are used to confirm trends objectively, helping to identify whether the market is in an uptrend or downtrend and the strength of that trend.
What is an impulsive wave and how is it identified?
-An impulsive wave is a market movement in the direction of the main trend, typically moving at a 45° angle up or down. It is identified by sequential price movements forming peaks and troughs, confirmed with indicators and momentum.
How are corrective waves described in the video?
-Corrective waves are movements that go against the main trend. They can vary in complexity, sometimes exceeding standard retracement levels, and are not necessarily downward in a bullish trend.
What is the significance of invalidation levels in trading analysis?
-Invalidation levels indicate points where an impulsive move fails, signaling that the expected trend may not continue. Traders use these levels to adjust strategy and stop-loss orders.
Why is understanding the 45° angle important in trend analysis?
-A 45° angle represents a balanced, healthy trend movement. Movements sharper than this may indicate overextension, while shallower movements may suggest weak momentum. It helps traders gauge trend strength objectively.
What are the recommended steps to confirm an impulsive wave completion?
-An impulsive wave is considered complete only after clear reversal signals, such as breaking the trend channel or failing to extend beyond Fibonacci levels. Confirmation involves both price action and supporting indicators.
How does the video suggest dealing with extended impulsive waves that exceed five counts?
-Extended impulsive waves may continue beyond the typical five-wave structure, sometimes reaching nine or more waves. Traders should use wave counting carefully and consider momentum and divergence indicators to analyze these extended patterns.
What is the purpose of using divergence in impulsive wave analysis?
-Divergence helps identify potential weakening of an impulsive wave. If price continues higher but indicators show a decreasing momentum, it signals a possible end of the impulsive move and prepares traders for trend changes.
How does the video define trend continuation within a channel?
-Trend continuation within a channel is defined as price movements that remain within a defined range, typically above support levels or the zero point, indicating that the impulsive trend is still active until confirmed otherwise.
Outlines

此内容仅限付费用户访问。 请升级后访问。
立即升级Mindmap

此内容仅限付费用户访问。 请升级后访问。
立即升级Keywords

此内容仅限付费用户访问。 请升级后访问。
立即升级Highlights

此内容仅限付费用户访问。 请升级后访问。
立即升级Transcripts

此内容仅限付费用户访问。 请升级后访问。
立即升级浏览更多相关视频
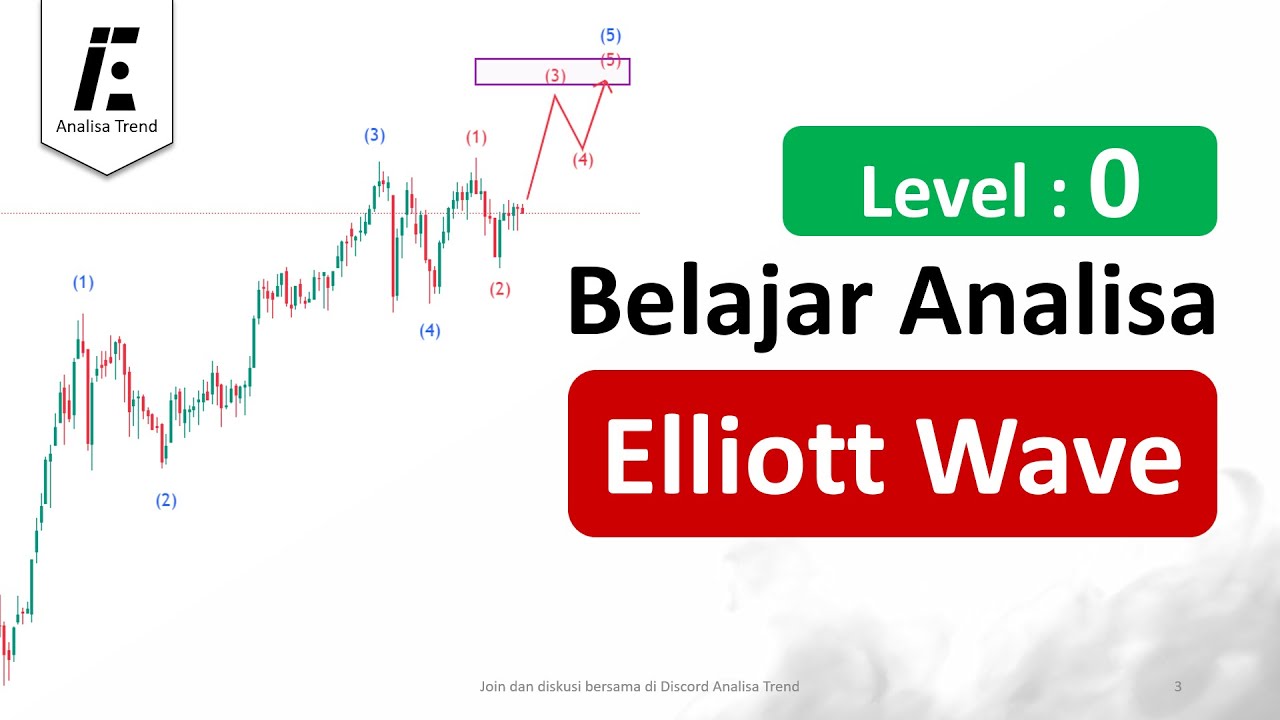
Belajar Analisa Elliott Wave level 0 | mengenal elliott wave

Elliott Waves & Fibonacci Retracement / Extension - Ep. 38 | Trading MasterClass 2.0

How to use Elliott Wave with Fibonacci

Belajar Lot Sizing dan Buat Trading Plan Saham Bareng Andy Senjaya Part 2/3
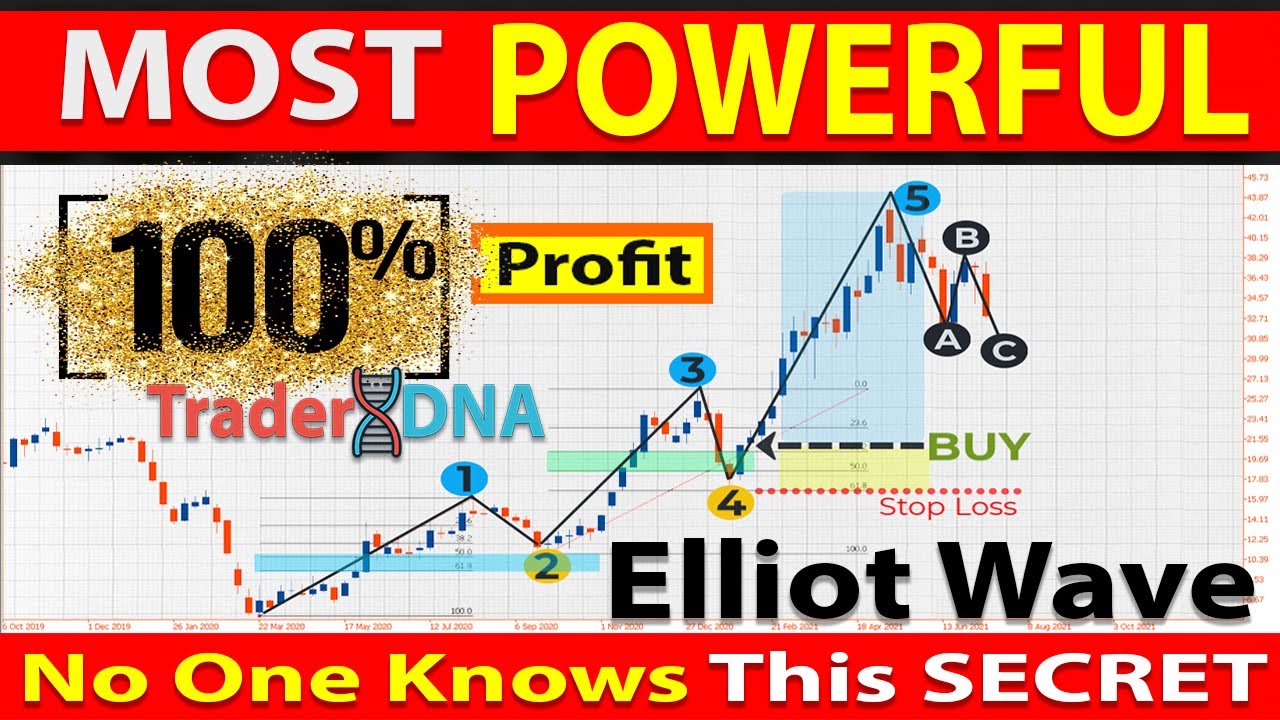
🔴 Most Effective "ELLIOT WAVE and FIBONACCI" Price Action Trading Strategy (Wave Trading Explained)
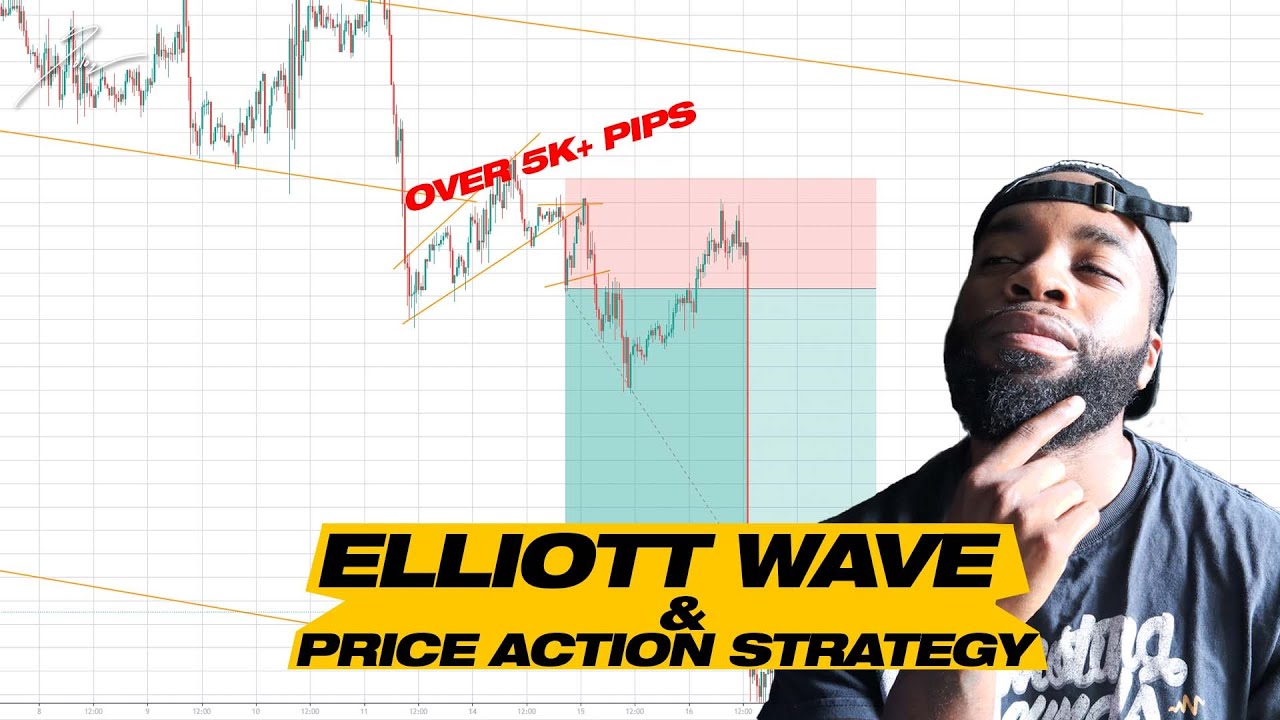
Backtesting with 🤯 Elliott wave & Price action | FOREX
5.0 / 5 (0 votes)
