Tutorial SEM PLS dengan Variabel Moderasi Menggunakan SmartPLS 4 FULL
Summary
TLDRThis tutorial video from the Tabrani Education channel offers a comprehensive guide on using Smart PLS 4 for Structural Equation Modeling (SEM) with moderation variables. It covers the process of importing data, setting up a PLS model with creativity as an independent variable, employee performance as dependent, and compensation as a moderating variable. The video explains hypothesis testing, model evaluation, and interpretation of results, including the significance of creativity and compensation in enhancing employee performance. It concludes with a demonstration of Goodness of Fit calculation, emphasizing the model's strong explanatory power.
Takeaways
- 📚 The tutorial is about using Smart PLS 4 for Structural Equation Modeling (SEM) with moderation variables.
- 🔍 It involves three variables: an independent variable (employee creativity), a dependent variable (employee performance), and a moderating variable (compensation).
- ✍️ The tutorial covers the hypothesis testing, with H1 suggesting a positive impact of creativity on performance and H2 that compensation strengthens this relationship.
- 📈 The data used in the tutorial includes three indicators for creativity, four for performance, and five for compensation, all saved in an Excel file.
- 💻 The Smart PLS 4 software is used for the analysis, and the tutorial guides through creating a new project and importing data.
- 📊 The outer model evaluation is performed to check for convergent validity and discriminant validity using the Fornell-Lacker criterion.
- 📉 Composite reliability and validity are assessed, with a cutoff of 0.7 for reliability and loading factors above 0.5 indicating convergent validity.
- 📐 The R Square value of 0.775 indicates that the model explains 77.5% of the variance in employee performance, suggesting a strong model.
- 🔢 The significance of the path coefficients is tested, with creativity having a positive and strong effect on performance (p-value of 0.029).
- 🔄 The interaction effect of compensation on the creativity-performance relationship is also significant, with a p-value of 0.019, indicating that compensation strengthens the positive impact of creativity on performance.
- 📉 The Goodness of Fit (GoF) value of 0.805 suggests that the overall model performance is in the 'large' category, indicating a good fit.
Q & A
What is the main topic of the tutorial in the provided script?
-The main topic of the tutorial is the use of Smart PLS 4 for Structural Equation Modeling (SEM) with moderation variables.
What are the three variables involved in the tutorial's model?
-The three variables are one independent variable (employee creativity), one dependent variable (employee performance), and one moderation variable (compensation).
What are the hypotheses being tested in the tutorial?
-There are two hypotheses: H1 states that creativity positively affects employee performance, and H2 suggests that compensation strengthens the impact of creativity on employee performance.
What is the significance of the R Square value in the context of this tutorial?
-The R Square value of 0.775 indicates that employee creativity and compensation together explain 77.5% of the variance in employee performance, suggesting a strong model.
How is the interaction effect between creativity and compensation represented in the model?
-The interaction effect is represented by multiplying the compensation variable with the creativity variable in the model, and it is automatically generated when the model is set up in Smart PLS 4.
What is the significance of the coefficient value and P-value in hypothesis testing?
-The coefficient value indicates the strength and direction of the relationship, while the P-value determines the statistical significance of the effect, with a value less than 0.05 typically considered significant.
What is the role of the Fornell-Larcker criterion in the tutorial?
-The Fornell-Larcker criterion is used to assess discriminant validity, ensuring that the square root of the average variance extracted (AVE) for each construct is greater than its correlations with other constructs.
What is the importance of composite reliability in the context of this tutorial?
-Composite reliability, measured by values like Cronbach's Alpha, indicates the internal consistency and reliability of the constructs in the model, with a value greater than 0.7 considered acceptable.
How is the Goodness of Fit (GoF) calculated in the tutorial?
-The GoF is calculated by multiplying the average variance extracted (AVE) by the R Square value and then taking the square root of the result, providing an overall measure of model performance.
What does the acceptance of H2 imply about the role of compensation in the model?
-The acceptance of H2 implies that compensation significantly strengthens the positive effect of creativity on employee performance, indicating a moderating role.
How does the script guide users in setting up the model in Smart PLS 4?
-The script provides a step-by-step guide, from creating a new project and importing data to setting up the model, adjusting the paths, and running calculations for model evaluation and hypothesis testing.
Outlines

此内容仅限付费用户访问。 请升级后访问。
立即升级Mindmap

此内容仅限付费用户访问。 请升级后访问。
立即升级Keywords

此内容仅限付费用户访问。 请升级后访问。
立即升级Highlights

此内容仅限付费用户访问。 请升级后访问。
立即升级Transcripts

此内容仅限付费用户访问。 请升级后访问。
立即升级浏览更多相关视频

TUTORIAL SEM PLS: METODE ANALISIS DATA
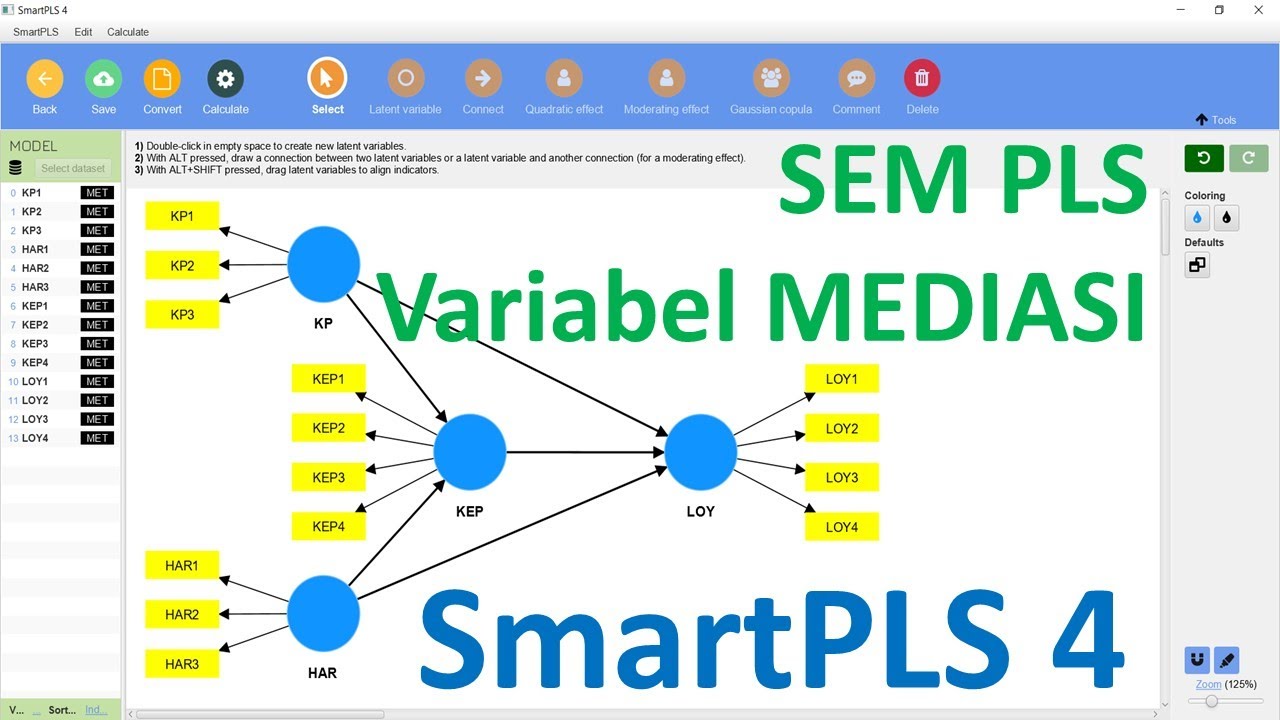
Tutorial SEM PLS dengan Variabel Mediasi Menggunakan SmartPLS 4 || Lengkap dengan referensi
TUTORIAL SMARTPLS 4: CARA MEMBUAT LAPORAN SEM PLS REFERENSI HAIR ET AL, 2022 (TERBARU)

HASIL ANALISIS SEM part 1
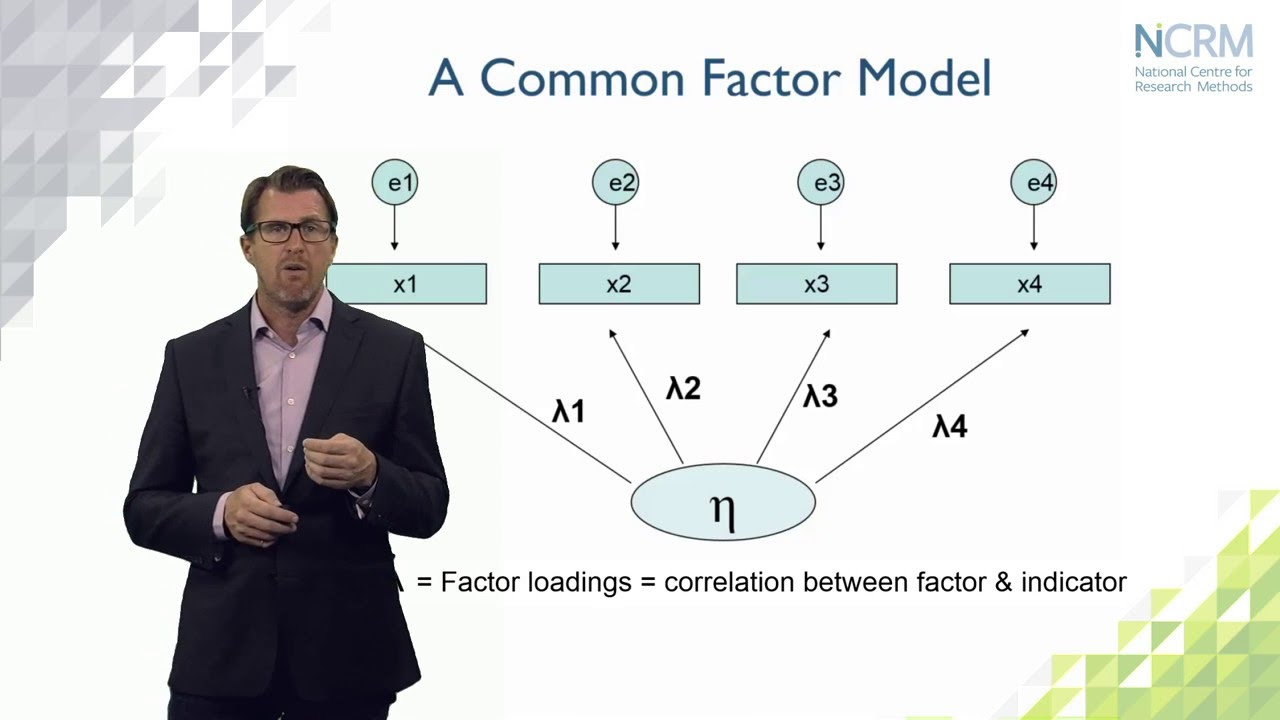
Structural Equation Modeling: what is it and what can we use it for? (part 1 of 6)

Dr. Arif Jauhar Tontowi - Video Mengenal Alat Analisis SEM - Bengkel Inovasi
5.0 / 5 (0 votes)
