Wilcoxon: Uji Non-Parametrik Komparasi Numerik Tidak Berpasangan
Summary
TLDRThis video provides an in-depth explanation of the Wilcoxon test, a nonparametric statistical method used for paired samples. It compares two measurements taken from the same sample, such as orthodontic treatment data (maxillary arch width before and after treatment). The script covers the process of performing the Wilcoxon test in statistical software, interpreting the results, and understanding when to use it based on data distribution. The video also explains key concepts like dependent and independent variables, sample data entry, and how to report results, making it a practical guide for those using nonparametric tests in research.
Takeaways
- 📊 The Wilcoxon Signed-Rank Test is a nonparametric test used to compare two related (paired) samples.
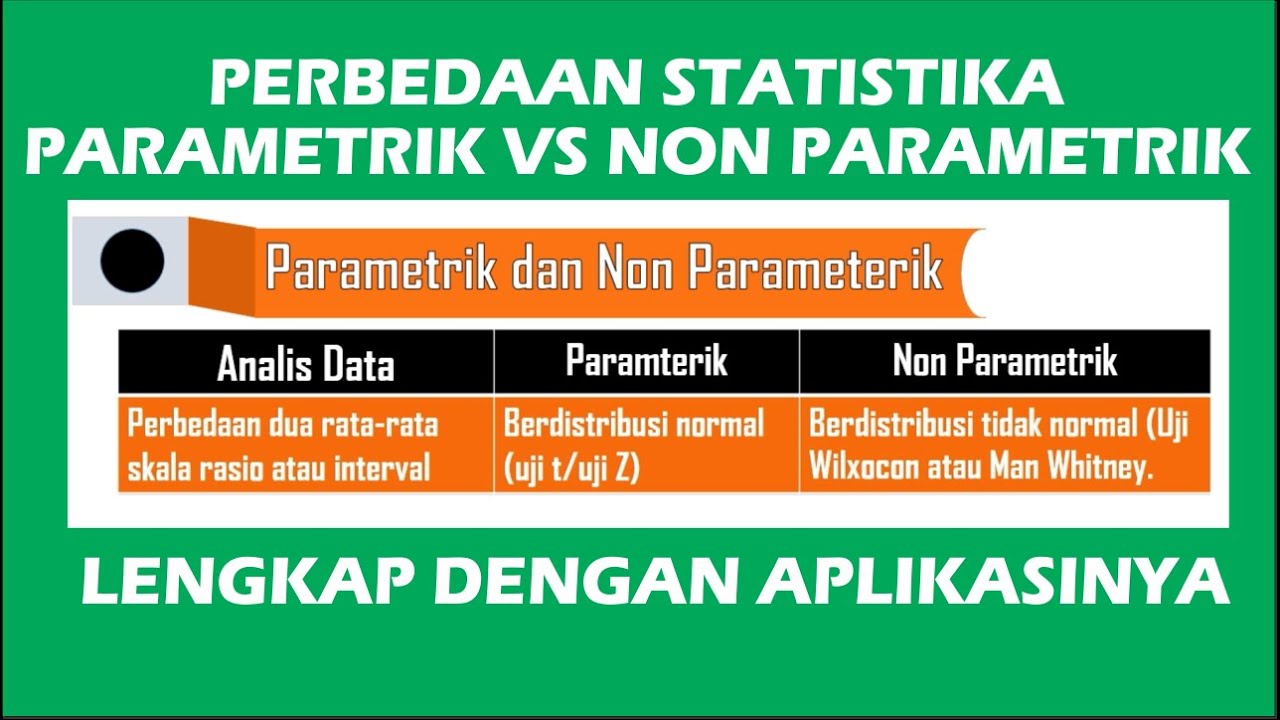
- 🔍 It is applied when the data distribution is not normal, unlike parametric tests which require normality.
- 👥 Paired data means the same subjects are measured twice, such as before and after treatment or UTS vs UAS scores.
- 📈 The dependent variable in the Wilcoxon test must be numerical, while the independent variable is categorical (e.g., before vs after).
- 🧪 A normality test (such as Shapiro-Wilk) should always be conducted first to determine whether to use parametric or nonparametric tests.
- ⚠️ If the p-value from the normality test is less than 0.05, the data is considered not normally distributed and Wilcoxon should be used.
- 💻 In SPSS, the Wilcoxon test can be run via Analyze → Nonparametric Tests → Legacy Dialogs → 2 Related Samples.
- 📉 The main result to interpret is the Asymp. Sig. (p-value); if it is less than 0.05, there is a significant difference between the two measurements.
- 🔄 Negative ranks indicate a decrease in values after treatment, positive ranks indicate an increase, and ties indicate no change.
- 📊 For nonparametric data, descriptive statistics should focus on median and minimum–maximum rather than mean and standard deviation.
- 🦷 In the example study, orthodontic treatment significantly reduced maxillary arch width in all patients.
- ✅ A p-value of 0.005 in the example confirms a statistically significant difference between before and after measurements.
Q & A
What is the main topic discussed in the script?
-The main topic discussed is the Wilcoxon test, a non-parametric statistical test used to compare paired samples, specifically in the context of orthodontic treatment and its effects on the width of the maxillary arch before and after treatment.
What type of data is used in the Wilcoxon test?
-The Wilcoxon test is used for paired data where the dependent variable is numerical (e.g., test scores or measurements) and the data is not normally distributed.
How does the Wilcoxon test differ from parametric tests?
-The Wilcoxon test is a non-parametric test, meaning it doesn't assume a normal distribution of the data. In contrast, parametric tests, such as t-tests, assume normality of the data and are used when the data follows a known distribution.
When should the Wilcoxon test be used?
-The Wilcoxon test should be used when comparing two related groups or measurements taken from the same sample, especially when the data is not normally distributed.
What is the purpose of checking for normality in the data before performing the Wilcoxon test?
-Checking for normality ensures that the data is appropriate for the non-parametric Wilcoxon test. If the data is normally distributed, a parametric test like the paired t-test might be more suitable.
What statistical software is mentioned for conducting the Wilcoxon test?
-The script mentions using SPSS (Statistical Package for the Social Sciences) for conducting the Wilcoxon test and analyzing the results.
What is the significance level in the Wilcoxon test and how is it interpreted?
-A p-value less than 0.05 indicates a significant difference between the paired samples. In the script, a p-value of 0.005 shows a significant reduction in the maxillary arch width after orthodontic treatment.
What does a negative rank indicate in the Wilcoxon test output?
-A negative rank indicates that the post-treatment measurement is smaller than the pre-treatment measurement. In the context of orthodontics, it means that the treatment led to a decrease in the width of the maxillary arch.
What is the role of descriptive statistics in analyzing Wilcoxon test results?
-Descriptive statistics, such as the median, minimum, and maximum values, help summarize the data and provide a clearer picture of how the measurements are distributed before and after treatment. They are particularly important when the data is not normally distributed.
Why is the Wilcoxon test suitable for paired measurements like orthodontic treatment data?
-The Wilcoxon test is ideal for paired measurements because it compares two related groups (e.g., before and after treatment) from the same sample. It is also non-parametric, making it robust to non-normal distributions commonly seen in clinical data.
Outlines

此内容仅限付费用户访问。 请升级后访问。
立即升级Mindmap

此内容仅限付费用户访问。 请升级后访问。
立即升级Keywords

此内容仅限付费用户访问。 请升级后访问。
立即升级Highlights

此内容仅限付费用户访问。 请升级后访问。
立即升级Transcripts

此内容仅限付费用户访问。 请升级后访问。
立即升级


5.0 / 5 (0 votes)
