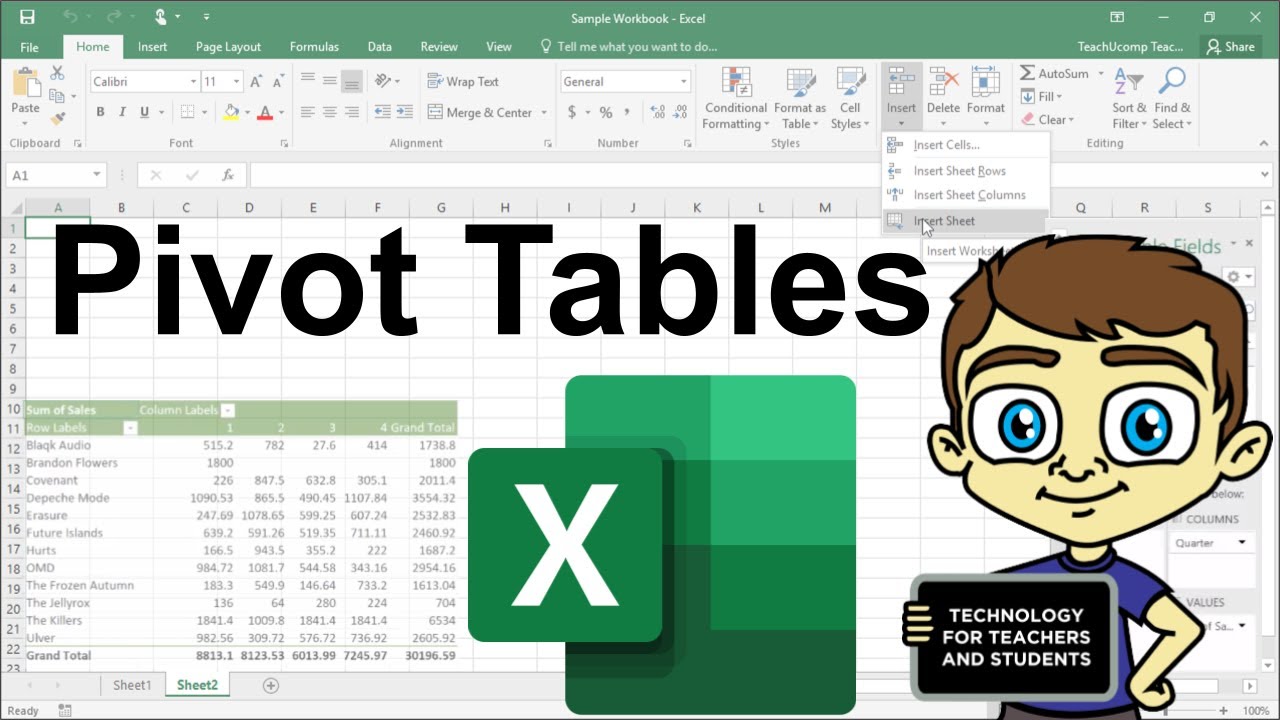
6 Massively time saving Pivot Table tricks (Don't miss #4 & #6) ⏰
Summary
TLDRIn this video, the presenter shares six powerful tips for using pivot tables more efficiently in Excel. These tricks include double-clicking to drill down into data, quickly formatting values, including filtered items in subtotals, ensuring consistent charts even with missing data, using tabular layouts for better data presentation, and generating multiple reports with the 'Report Pages' feature. These time-saving strategies aim to streamline data analysis, saving users time and effort while enhancing their productivity with pivot tables.
Takeaways
- 😀 Double-click to drill down: Quickly view the data points behind pivot table values by double-clicking on a cell in the values area.
- 😀 Faster formatting: Right-click on a pivot table value field and use the 'Number Format' button for quick formatting instead of going through multiple steps.
- 😀 Include filtered values in subtotals: Use the data model to include filtered items in subtotals and grand totals for more accurate calculations.
- 😀 Include items with no data: Prevent inconsistencies in pivot charts by including items with no data, ensuring consistent bar or column sizes.
- 😀 Tabular layout for better structure: Use tabular layout in pivot tables to display data in multiple columns, making it easier to analyze and compare.
- 😀 Repeat labels in tabular reports: Enable 'Repeat All Labels' in the Design ribbon to avoid missing repeated data entries in tabular pivot tables.
- 😀 Report pages feature: Use the 'Report Filter' and 'Report Pages' feature to quickly generate pivot table pages for each region or category without manual duplication.
- 😀 Drilling down into subtotals: Drill down into subtotals and grand totals for more detailed insights into the data behind them.
- 😀 Deleting extra worksheets: After drilling down, delete the generated worksheets to avoid clutter and unnecessary duplicates.
- 😀 Time-saving shortcuts: These tricks can significantly speed up your work and improve productivity when working with pivot tables.
Q & A
What is the first tip mentioned in the video about pivot tables?
-The first tip is to double-click on a cell in the pivot table's values area to drill down and see the underlying data points. This creates a new worksheet showing all the data related to that particular value.
What should you do after drilling down into a pivot table using the double-click feature?
-After drilling down, it's important to delete the new worksheet created to avoid cluttering your file with duplicate data.
How can you quickly format values in a pivot table without going through multiple steps?
-You can right-click on the value field in the pivot table and use the 'Number Format' button to quickly apply formatting such as currency, accounting, or number format to all values in that area.
What is the significance of the 'Include Filtered Items in Totals' option in pivot tables?
-This option allows you to include filtered-out data in the subtotal, but it is only available when creating a pivot table from the data model. It helps ensure that grand totals are accurate by including filtered-out data.
How can you include items with no data in a pivot chart or table?
-You can configure Excel to include items with no data by adjusting the pivot table settings. This helps avoid inconsistent bar or column sizes in pivot charts, especially when comparing regions with different numbers of products.
What does the 'Tabular Layout' feature in pivot tables do?
-The 'Tabular Layout' feature in pivot tables allows you to display data in a structured format, with each type of data in its own column. It’s useful for creating detailed reports where you want to show individual items, like salesperson details by region.
How can you make labels in a pivot table repeat for each row?
-In the design ribbon of the pivot table, you can enable the 'Repeat All Labels' option to ensure that labels, such as regions or salesperson names, are repeated across rows for better readability.
What is the 'Report Filters' and 'Report Pages' feature in pivot tables?
-The 'Report Filters' feature allows you to filter your pivot table by specific fields (e.g., region). The 'Report Pages' option lets you quickly generate separate pages for each filter, creating a separate pivot table on each tab based on the selected field.
How can you save time when creating multiple pivot tables for different regions or categories?
-Instead of creating individual pivot tables manually, you can use the 'Report Pages' feature to automatically generate a pivot table for each selected region or category, saving time and effort.
Why is it important to delete unnecessary worksheets when drilling down in pivot tables?
-Deleting unnecessary worksheets is important to prevent your file from becoming cluttered with extra data. Pivot tables can create many worksheets when drilling down, and these can quickly accumulate, making your file harder to manage.
Outlines

此内容仅限付费用户访问。 请升级后访问。
立即升级Mindmap

此内容仅限付费用户访问。 请升级后访问。
立即升级Keywords

此内容仅限付费用户访问。 请升级后访问。
立即升级Highlights

此内容仅限付费用户访问。 请升级后访问。
立即升级Transcripts

此内容仅限付费用户访问。 请升级后访问。
立即升级浏览更多相关视频

Learn Excel Pivot Tables in 10 Minutes - A complete beginner's tutorial

10 Essential Pivot Table Tricks In Excel

Pivot Table Mistakes You're Probably Making (And How to Fix Them!)

pivot table for beginners in excel in Hindi | pivot table excel in hindi
Advanced Excel - Creating Pivot Tables in Excel

Excel Tutorial : pivot table for beginners | pivot table in excel in hindi
5.0 / 5 (0 votes)
