An Introduction to Linear Regression Analysis
Summary
TLDRThis tutorial introduces the concept of linear regression, where a straight line is used to model the relationship between an independent variable (X) and a dependent variable (Y). It explains the positive and negative relationships between variables, such as study time and grades, or time spent on Facebook and grades, respectively. The tutorial covers the least squares method for fitting the regression line, aiming to minimize errors between estimated and actual values. It also touches on the development of the regression equation, involving the y-intercept (B naught) and slope (B 1), which will be further elaborated in subsequent videos.
Takeaways
- 📈 The tutorial introduces the concept of regression analysis involving an X (independent) variable and a Y (dependent) variable.
- 📊 The X variable is placed on the x-axis, and the Y variable is on the y-axis, aiming to establish a relationship between them.
- 🔍 The tutorial discusses how changes in the independent variable affect the dependent variable, indicating whether they move in the same or opposite directions.
- ➡️ A positive relationship is identified when both variables increase together, while a negative relationship is when one increases as the other decreases.
- 📐 Linear regression involves fitting a straight line to the data points, which represents the relationship between the variables.
- 🔧 The least squares method is used to determine the best-fit line that minimizes the difference between estimated and actual values.
- 📉 The goal of regression is to minimize errors, aiming for the smallest possible discrepancies between predictions and observations.
- 🧠 The script mentions an example where study time (independent) is related to grades (dependent), indicating a positive relationship.
- 📚 Another example given is time spent on Facebook (independent) negatively affecting grades (dependent), illustrating a negative relationship.
- 📝 The regression equation is introduced as "\( \hat{y} = b_0 + b_1 \times X \)", where \( b_0 \) is the y-intercept and \( b_1 \) is the slope of the line.
- 🔬 The tutorial promises to explain in later videos how to derive the coefficients \( b_0 \) and \( b_1 \) mathematically.
Q & A
What is the main focus of this tutorial?
-The tutorial focuses on an introduction to regression, explaining the relationship between independent (X) and dependent (Y) variables.
What are the two types of variables typically involved in regression analysis?
-The two types of variables are the independent variable (X), which is on the x-axis, and the dependent variable (Y), which is on the y-axis.
What does it mean if the independent variable increases and the dependent variable also increases?
-If the independent variable increases and the dependent variable increases as well, there is a positive relationship between them.
What is the term used to describe the scenario where an increase in the independent variable leads to a decrease in the dependent variable?
-This scenario is described as a negative relationship.
What is the goal of linear regression?
-The goal of linear regression is to find a straight line that best fits the data points, minimizing the difference between the estimated and actual values.
What method is commonly used to determine the best-fitting line in linear regression?
-The least squares method is commonly used to determine the best-fitting line in linear regression.
What is the purpose of the regression line in the context of the tutorial?
-The regression line is used to estimate the dependent variable's value based on the independent variable, with the aim of minimizing errors.
What does 'y hat' represent in the context of the tutorial?
-'y hat' represents the estimated value of the dependent variable in the regression equation.
What are 'B naught' and 'B 1' in the regression equation, and what do they represent?
-'B naught' is the y-intercept of the regression line, and 'B 1' is the slope of the line, representing the rate of change of the dependent variable with respect to the independent variable.
How does the tutorial illustrate the relationship between study time and grades?
-The tutorial illustrates a positive relationship between study time and grades, suggesting that as study time increases, grades should also go up.
What is the relationship between time spent on Facebook and grades according to the tutorial?
-The tutorial suggests a negative relationship between time spent on Facebook and grades, indicating that more time on Facebook could lead to lower grades.
What is the role of the independent variable in the context of regression?
-The independent variable is what is controlled, manipulated, or changed in an experiment or study to observe its effect on the dependent variable.
How does the tutorial plan to simplify the understanding of regression equations?
-The tutorial plans to step through the process in a step-by-step manner in the next video, aiming to make the concept of regression equations simple and clear.
Outlines

此内容仅限付费用户访问。 请升级后访问。
立即升级Mindmap

此内容仅限付费用户访问。 请升级后访问。
立即升级Keywords

此内容仅限付费用户访问。 请升级后访问。
立即升级Highlights

此内容仅限付费用户访问。 请升级后访问。
立即升级Transcripts

此内容仅限付费用户访问。 请升级后访问。
立即升级浏览更多相关视频
35. Regressione Lineare Semplice (Spiegata passo dopo passo)

Regression and R-Squared (2.2)
Simple Linear Regression Simplified | Orange Data Mining Tutorial
Statistics 101: Multiple Linear Regression, The Very Basics 📈
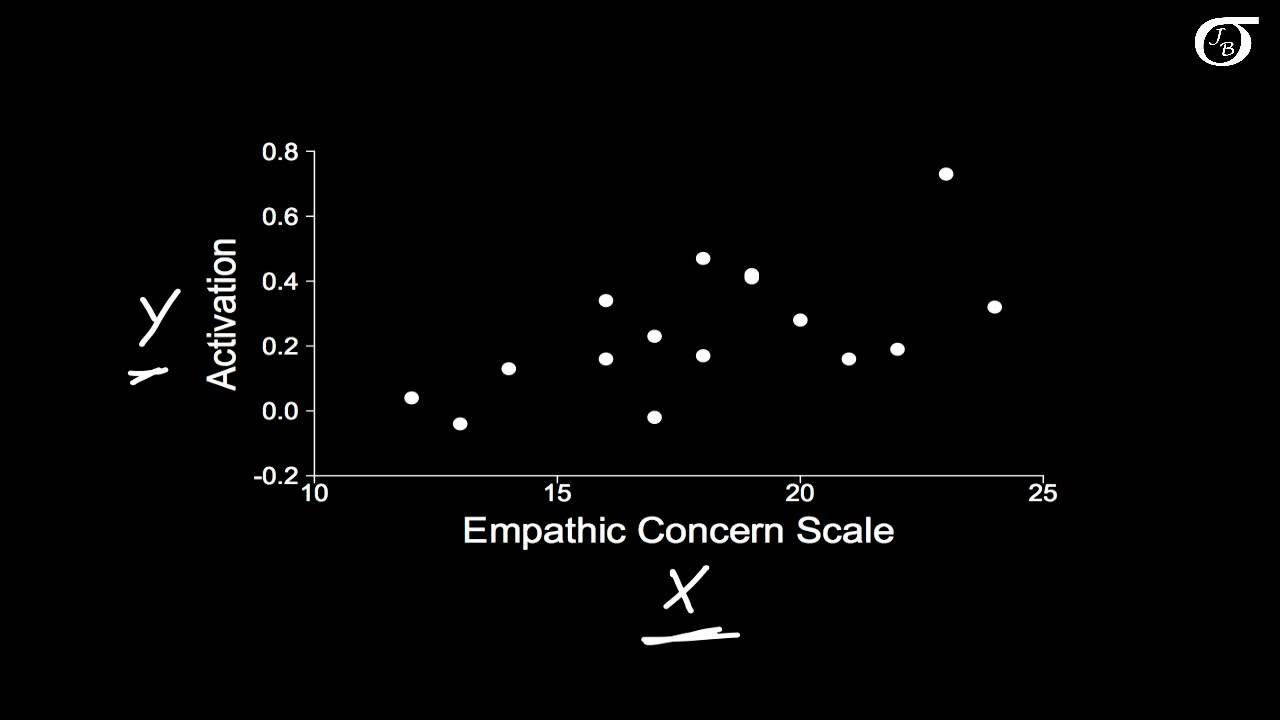
Introduction to Simple Linear Regression
Uji Regresi Linear Sederhana dengan SPSS Sangat Detail
5.0 / 5 (0 votes)
