Risks versus rates in modelling
Summary
TLDRThis video explains the difference between risk and rate in statistical modeling, particularly in survival analysis. It explores how risk is a probability over a specified period, while rate is the instantaneous hazard of an event occurring over time, often expressed per 100,000 person-years. Through examples, it demonstrates how to convert between risk and rate, highlighting key formulas. The video also covers survival functions, conditional survival functions, and hazard distributions (e.g., exponential, Weibull, Gompertz), illustrating how these concepts are applied in cohort studies and mortality modeling.
Takeaways
- 😀 Risks are expressed as probabilities ranging from 0 to 1, and are tied to a specific time period (e.g., risk of dying in the next year).
- 😀 Rates represent the instantaneous hazard of an event happening and are often expressed as the number of events per 100,000 person-years.
- 😀 The risk of an event is calculated by dividing the number of events by the total number of people at risk during a time period.
- 😀 Rates are calculated by dividing the number of events by the number of person-years at risk, taking into account that a person may experience multiple events.
- 😀 A key difference: Risks focus on the probability of an event happening within a given time frame, while rates focus on the hazard or occurrence of events over time.
- 😀 In a cohort of 100,000 people, the risk of death is calculated by dividing the number of deaths by the total cohort size, whereas the rate accounts for person-years lived.
- 😀 You can convert between risks and rates if the rate is constant and the time period is known, using formulas like 1 - e^(-rate × time).
- 😀 Survival functions give the probability of surviving up to a certain time, and they are related to the cumulative distribution function (CDF) of failure events.
- 😀 The conditional survival function calculates the probability of surviving to a later time, given survival up to an earlier time.
- 😀 Hazard functions describe the instantaneous risk of an event, and can be derived from the survival function and its relationship with the CDF, providing insights into event likelihood over time.
Q & A
What is the difference between risk and rate in the context of modeling?
-Risk is usually expressed as a probability ranging from 0 to 1 (or 0% to 100%) and refers to the likelihood of an event occurring over a specified time period. Rate, on the other hand, is the instantaneous hazard of an event and is often expressed as the number of events per 100,000 person-years, accounting for the time people were actually at risk.
How is the risk of an event calculated?
-Risk is calculated by dividing the number of events within a specified time period by the number of people at risk during that period.
How are rates different from risks in terms of time?
-Rates represent the instantaneous hazard of an event and are calculated based on person-years at risk, whereas risks refer to the probability of an event occurring over a defined period, such as one year.
How can we convert between risks and rates?
-You can convert from a rate to a risk using the formula: Risk = 1 - e^(-rate * time). To convert from a risk to a rate, you can use: Rate = -ln(1 - risk) / time, where 'time' is the period over which the rate or risk is defined.
What happens when the rate is very small in relation to the risk?
-When the rate is small, the risk is approximately equal to the rate because higher powers of the rate (such as rate squared or cubed) become negligible, making the approximation accurate.
What is a survival function in probability theory?
-A survival function, denoted as S(t), gives the probability that a random event occurs later than a specified time t, meaning the event has not yet occurred at time t.
How is the conditional survival function different from the regular survival function?
-The conditional survival function calculates the probability of surviving to a later time t2, given that the individual has already survived up to an earlier time t1. It is calculated as S(t2 | t1) = S(t2) / S(t1).
What is the Gompertz distribution, and how is it useful?
-The Gompertz distribution is commonly used for modeling mortality because it effectively captures general mortality patterns. It has two parameters: one for scale and one for shape, allowing flexibility in modeling different hazard rates over time.
What is the hazard rate and how is it calculated?
-The hazard rate is the instantaneous risk of an event happening at a specific time. It can be calculated as the ratio of the probability density function (f) to the survival function (S). It represents how the risk of an event changes over time.
What are the differences between the exponential, Weibull, and Gompertz hazard functions?
-The exponential hazard function is constant over time. The Weibull hazard function can either increase or decrease over time depending on the shape parameter. The Gompertz hazard function allows for exponential growth or shrinkage in hazard, depending on its parameters.
Outlines

此内容仅限付费用户访问。 请升级后访问。
立即升级Mindmap

此内容仅限付费用户访问。 请升级后访问。
立即升级Keywords

此内容仅限付费用户访问。 请升级后访问。
立即升级Highlights

此内容仅限付费用户访问。 请升级后访问。
立即升级Transcripts

此内容仅限付费用户访问。 请升级后访问。
立即升级浏览更多相关视频
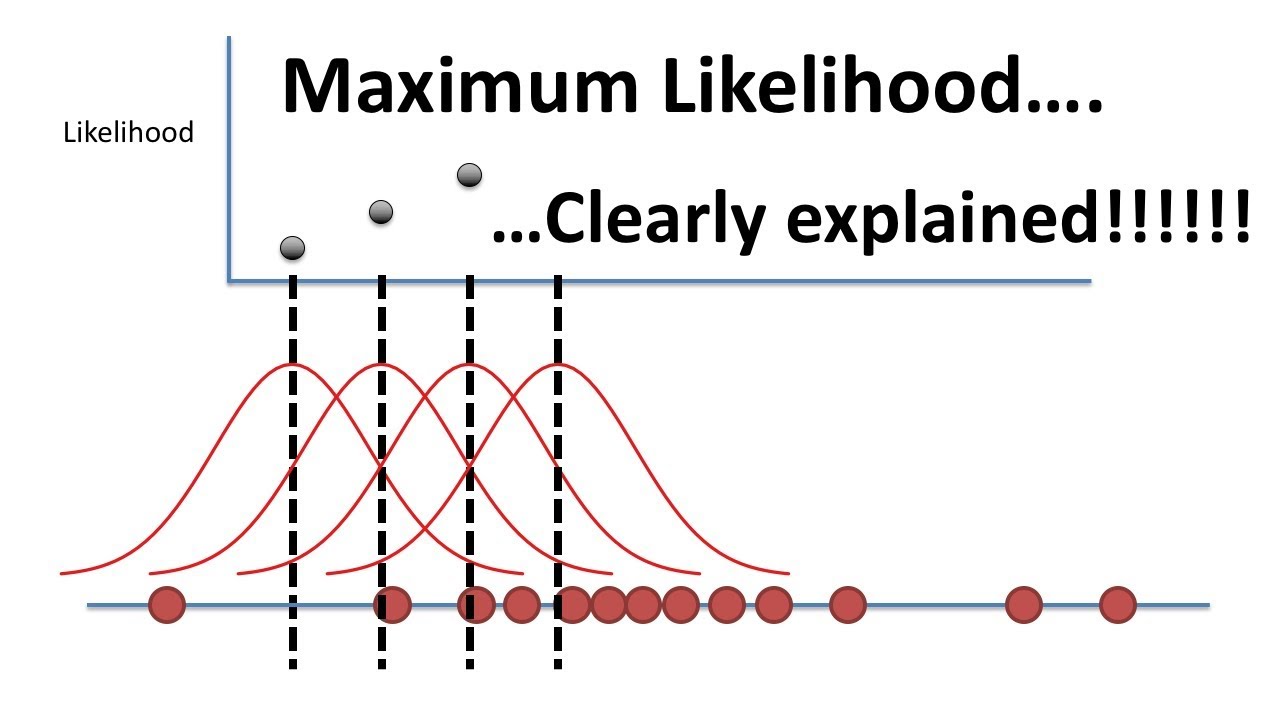
Maximum Likelihood, clearly explained!!!

SPSS VS SMARTPLS || Perbedaan || mana yg harus kita gunakan ❓❓
Data Mining 09 - Korelasi & Analisa Regresi (1/2)

Business Analyst Interview Questions & Answers | Business Analyst Interview Preparation | Edureka

Pendahuluan: Perbandingan waktu pada model survival dan model runtun waktu

TPAI Materi Pembelajaran 3: Konsep Return dan Risiko Investasi
5.0 / 5 (0 votes)
