How to check normal distribution | The normality assumption
Summary
TLDRThis video explains how to check if data comes from a normal distribution using histograms, QQ plots, and the Shapiro-Wilk test. It demonstrates how different sample sizes and random sampling can affect the results. With small samples, the histogram and QQ plot may not show a clear normal distribution, but the Shapiro-Wilk test can help draw conclusions. The video also explores how the test performs across different distributions, emphasizing the importance of sample size and test significance level. It concludes with guidance on assuming normality and choosing between parametric and non-parametric tests based on the data's characteristics.
Takeaways
- 😀 A normal distribution has a bell-shaped curve, and checking if data follows this distribution is essential for many statistical tests.
- 😀 Three methods to check if data follows a normal distribution are histograms, QQ plots, and the Shapiro-Wilk test.
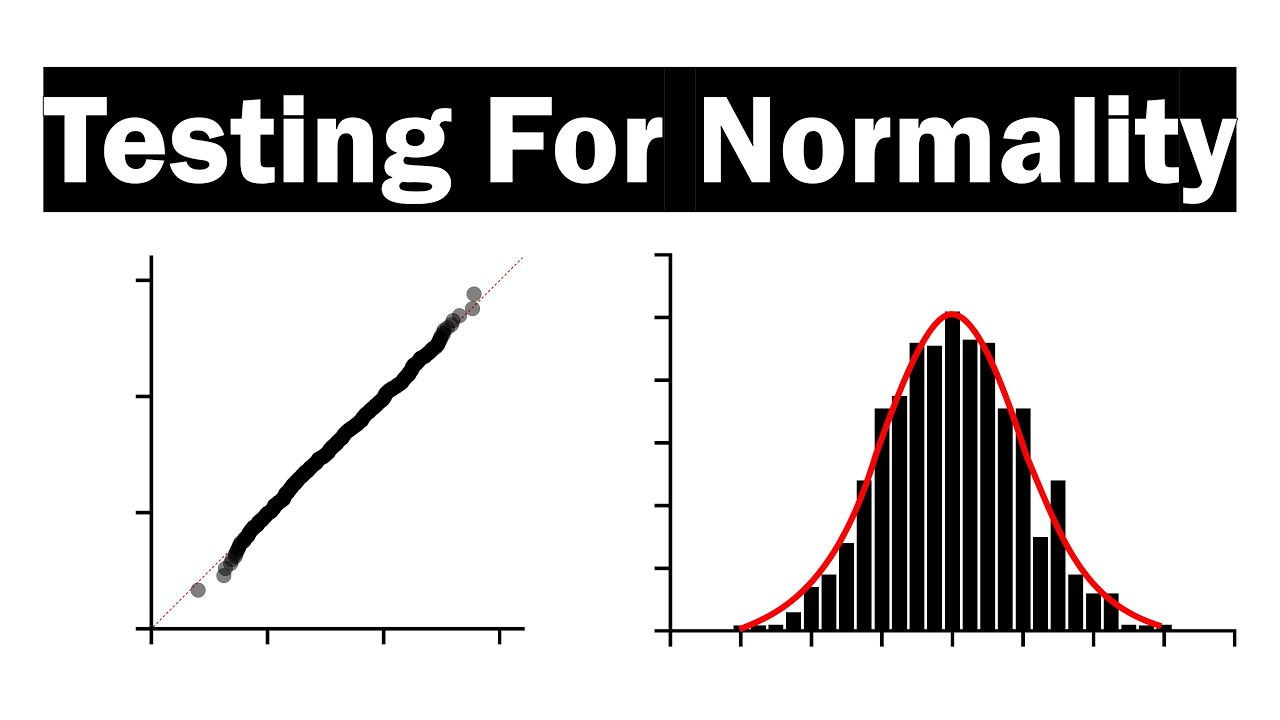
- 😀 Histograms display the distribution of data, and a bell-shaped histogram suggests the data may be normally distributed.
- 😀 QQ plots compare the data’s quantiles with a normal distribution’s quantiles. If the points form a straight line, the data likely follows a normal distribution.
- 😀 The Shapiro-Wilk test checks for normality, where a p-value > 0.05 means the data likely comes from a normal distribution.
- 😀 Small sample sizes (e.g., 9 or 10 individuals) may produce misleading histograms and QQ plots, making it harder to detect normality.
- 😀 For small sample sizes, the Shapiro-Wilk test is more reliable than visual methods like histograms or QQ plots.
- 😀 Larger sample sizes (e.g., 1000 individuals) provide more reliable conclusions about normality, with clearer histograms and QQ plots.
- 😀 Non-normal distributions, like exponential or skewed distributions, often show clear deviations from normality in QQ plots and Shapiro-Wilk test results.
- 😀 For small sample sizes, non-parametric tests are preferred when the Shapiro-Wilk test indicates non-normality, and transformations (e.g., log transformation) can be used for skewed data.
Q & A
What are the three main methods to check if data comes from a normal distribution?
-The three main methods to check if data comes from a normal distribution are histograms, QQ plots, and statistical tests like the Shapiro-Wilk test.
How can a histogram help in assessing if data comes from a normal distribution?
-A histogram provides a visual representation of the data's distribution. If the histogram resembles a bell curve, it suggests that the data may follow a normal distribution. However, with small sample sizes, the histogram may not clearly show the normal distribution shape.
What does a QQ plot show, and how is it used to test normality?
-A QQ plot compares the quantiles of the sample data with the quantiles of a normal distribution. If the data points lie along a straight line in the plot, it indicates that the data follows a normal distribution.
What is the purpose of the Shapiro-Wilk test, and what does the p-value indicate?
-The Shapiro-Wilk test is a statistical test that checks the null hypothesis that data comes from a normal distribution. A p-value greater than 0.05 suggests that the data is normally distributed, while a p-value less than 0.05 indicates the data is unlikely to come from a normal distribution.
How does sample size affect the interpretation of normality tests?
-Smaller sample sizes make it harder to detect a normal distribution visually or through statistical tests. Larger sample sizes (e.g., 1000 individuals) tend to provide clearer evidence of normality, while smaller samples may result in misleading conclusions, especially when using visual methods like histograms and QQ plots.
Why is it harder to detect normality in small sample sizes?
-In small sample sizes, random fluctuations can cause the data to deviate from a perfect normal distribution, making it difficult to visually assess normality. As a result, statistical tests like the Shapiro-Wilk test are more reliable for small samples, but they can still produce errors.
What happens if a data set from a normal distribution is mistakenly classified as non-normal?
-If a sample from a normal distribution is incorrectly classified as non-normal, the risk is that researchers may use inappropriate statistical methods (e.g., non-parametric tests) that may not be as powerful as parametric tests, potentially leading to less accurate conclusions.
How can non-normal distributions, like exponential or uniform distributions, affect normality tests?
-Non-normal distributions such as exponential or uniform distributions may still appear normal in small samples due to random sampling variability. This can lead to incorrect conclusions, where the data is mistakenly identified as normal, especially in the case of the Shapiro-Wilk test.
What role does the central limit theorem play in assuming normality?
-The central limit theorem states that as the sample size increases, the sample means will tend to be normally distributed, even if the original data is not. This allows for assuming normality in large samples, even if the underlying data is skewed or from a non-normal distribution.
What should be done if data is highly skewed but the sample size is large?
-If data is highly skewed but the sample size is large, the central limit theorem suggests that the sample means will still be approximately normal. However, non-parametric tests can also be used to account for skewed data, or a log transformation may be applied to the data to make it more normal.
Outlines

此内容仅限付费用户访问。 请升级后访问。
立即升级Mindmap

此内容仅限付费用户访问。 请升级后访问。
立即升级Keywords

此内容仅限付费用户访问。 请升级后访问。
立即升级Highlights

此内容仅限付费用户访问。 请升级后访问。
立即升级Transcripts

此内容仅限付费用户访问。 请升级后访问。
立即升级


5.0 / 5 (0 votes)
