Exploring COFF[IE]: Dunkin Donuts vs. Starbucks, an Industrial Engineering Analysis
Summary
TLDRThe project compares the operations of Starbucks and Dunkin' Donuts using industrial engineering and queuing theory. The team collected data over five days at both locations, analyzing customer service times and processes. Using Arena simulation software and Minitab, the team created simulations of each store's operations to improve customer flow. Key findings reveal that Dunkin' Donuts has faster service times due to simpler processes, while Starbucks focuses more on customer satisfaction. The research suggests that simulations can optimize business operations and potentially increase profitability by altering resource management and workflow.
Takeaways
- 😀 Background: The project compared customer service efficiency between Starbucks and Dunkin' Donuts using industrial engineering and queuing theory.
- 😀 The project involved analyzing customer service data using simulation software (Arena) and statistical tools (Minitab) to optimize efficiency.
- 😀 Starbucks prioritizes customer satisfaction with a relaxed atmosphere, while Dunkin' Donuts focuses on quick service with a faster turnover of customers.
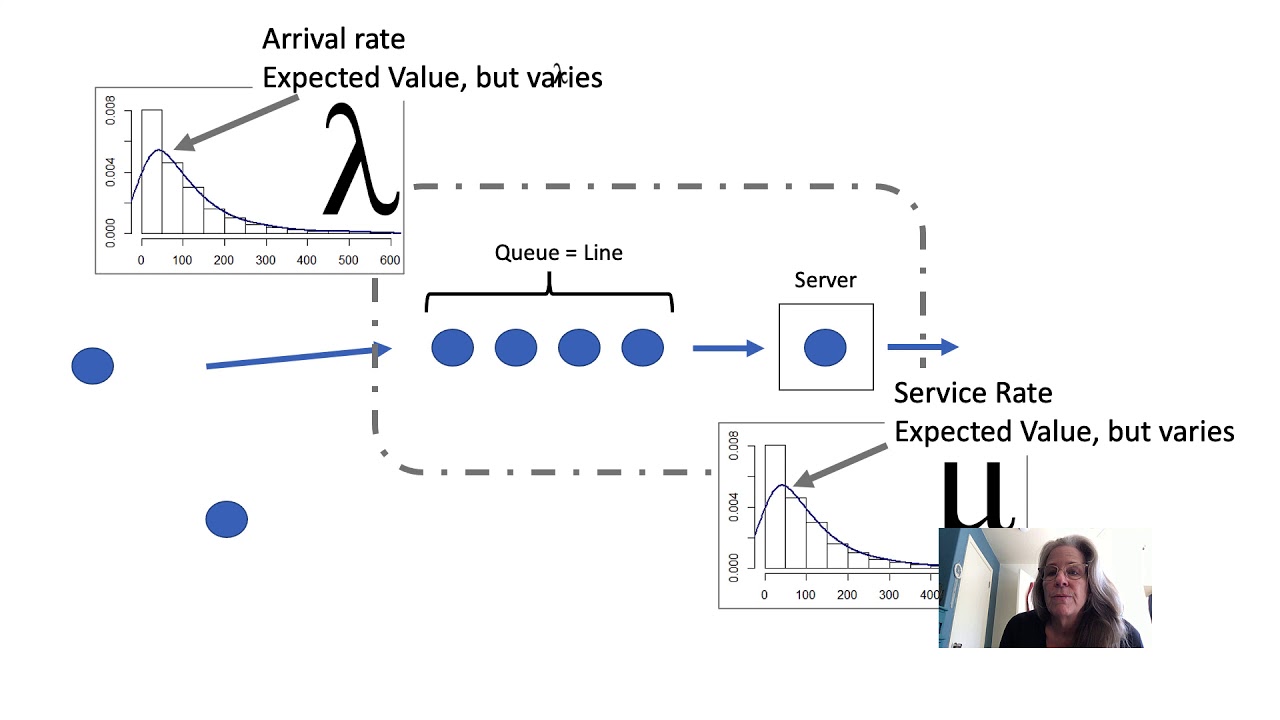
- 😀 The research utilized queueing theory to model customer flow and efficiency at both stores, highlighting the differences in their business models.
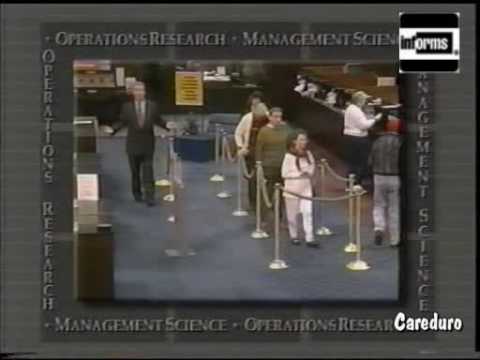
- 😀 Data collection was done over five days at Dunkin' Donuts and Starbucks in New Brunswick, using a timer app to measure customer wait times and service times.
- 😀 Human error in timing and inconsistent methodologies were some challenges encountered during the data collection process.
- 😀 Statistical analysis using Minitab helped identify the best probability distributions to represent the observed data, improving the accuracy of the simulations.
- 😀 The research used simulations to predict customer service times and test different scenarios for both stores, including varying resources and processes.
- 😀 The results of the simulations were tested for accuracy using the Kolmogorov-Smirnov test, comparing observed and simulated data distributions.
- 😀 Future applications of the simulation model include experimenting with resource management, workflow rotation, and testing new operational strategies to improve efficiency.
Q & A
What was the main objective of the project?
-The main objective of the project was to compare the service processes at Starbucks and Dunkin' Donuts, using industrial engineering principles and simulations to improve customer service efficiency and productivity.
How did the team collect data for the study?
-The team collected data by observing Dunkin' Donuts and Starbucks stores in New Brunswick over a span of five days. They used a timer application to record the time from when a customer entered the line to when they received their order.
What challenges did the team face during data collection?
-The team faced challenges such as human error in starting and stopping the timer, as well as inconsistencies in data collection methods among the team members during the first day of observations.
What is the significance of using queueing theory in this project?
-Queueing theory was used to model the customer service processes at Starbucks and Dunkin' Donuts. It helps optimize customer flow, identify bottlenecks, and improve the efficiency of service delivery.
What statistical tool did the team use to analyze the data?
-The team used Minitab, a statistical software, to analyze the data. They ran basic descriptive statistics and hypothesis tests to determine the best probability distributions for the collected data.
What was the purpose of the Arena simulation software in this project?
-The Arena simulation software was used to model the service processes at Starbucks and Dunkin' Donuts. It allowed the team to input the observed data and simulate real-world scenarios to improve customer flow and efficiency.
What does the Kolmogorov-Smirnov test measure in the context of this study?
-The Kolmogorov-Smirnov test compares the cumulative distributions of observed and simulated data sets. It helps determine whether the distributions match, providing insight into the accuracy of the simulations.
How did the simulation results compare to the observed data?
-The simulation results were largely accurate and closely matched the observed data. For instance, the distribution of service times at Starbucks and Dunkin' Donuts were similar between the observed and simulated data.
What were the key findings from the study?
-The key findings were that Dunkin' Donuts had shorter overall service times due to quicker drink production processes and faster customer flow, while Starbucks provided a more customer-focused experience, which involved longer wait times.
What future applications were suggested based on the study?
-Future applications include using simulations to experiment with different resource management strategies, such as adjusting the number of cashiers or altering workflow rotations, to improve service efficiency and profitability.
Outlines

此内容仅限付费用户访问。 请升级后访问。
立即升级Mindmap

此内容仅限付费用户访问。 请升级后访问。
立即升级Keywords

此内容仅限付费用户访问。 请升级后访问。
立即升级Highlights

此内容仅限付费用户访问。 请升级后访问。
立即升级Transcripts

此内容仅限付费用户访问。 请升级后访问。
立即升级浏览更多相关视频


5.0 / 5 (0 votes)
