LTspice simulation | Examples in LTspice | RC Circuits | SPICE simulation
Summary
TLDRThis video tutorial provides a step-by-step guide to using the LTSpice simulator for circuit analysis. It covers the installation process, creating simple RC circuits, and performing transient, AC, and DC operating point analysis. Key techniques such as wiring components, setting simulation commands, and observing voltage and current responses are demonstrated. The tutorial also highlights the use of LTSpice's simulation commands to analyze circuit behavior, helping beginners learn how to simulate and analyze electrical circuits effectively. The content is designed to make LTSpice accessible, even for those new to circuit simulation.
Takeaways
- 😀 Download and install LTSpice from the official website by searching for it on Google, ensuring to turn off antivirus software if needed during installation.
- 😀 To create a new schematic, go to 'File' > 'New Schematic' and save your work with a meaningful name, such as 'RC_Transient'.
- 😀 Familiarize yourself with essential tools in LTSpice, including components like resistors, capacitors, voltage sources, and the ground tool.
- 😀 Use the wire tool (shortcut F3) to connect components in your circuit, ensuring every voltage reference is grounded.
- 😀 In LTSpice, component values can be set by right-clicking on the components and editing their properties (e.g., resistance, capacitance, voltage).
- 😀 For transient analysis, set simulation parameters like stop time (200ms) and run the simulation to visualize the voltage output of the circuit.
- 😀 To label and plot voltage waveforms, click on the relevant wires (e.g., V_out) after running the simulation.
- 😀 In AC small-signal analysis, replace the DC voltage source with an AC source and specify parameters like amplitude and frequency range (e.g., 1Hz to 1MHz).
- 😀 Use AC analysis to observe the amplitude and phase response of the circuit across different frequencies and identify key characteristics like the cutoff frequency.
- 😀 Perform a DC operating point analysis to find the voltage and current at different nodes in a simple circuit with resistors and a DC voltage source.
Q & A
What is the first step to start using the LTSpice simulator?
-The first step is to download and install the LTSpice simulator. Go to Google, search for 'LTSpice', and download it from the official website. Once downloaded, you can install it on your Windows machine.
What should you do if LTSpice installation faces issues due to antivirus software?
-If the installation is blocked by antivirus software, you can temporarily disable the antivirus for the duration of the installation and then reinstall it.
What is the purpose of the 'Ground' symbol in LTSpice?
-The 'Ground' symbol in LTSpice is used to define a reference point for voltages in the circuit. All voltages are defined with respect to the ground node.
How can you rotate a component in LTSpice?
-To rotate a component in LTSpice, select the component and press 'Ctrl + R' on the keyboard.
What is the significance of labeling a wire in LTSpice?
-Labeling a wire in LTSpice is important for identifying the node points of your circuit. For example, labeling the output voltage as 'Vout' helps to track and display the voltage at specific points in your simulation.
What kind of analysis is done in the first example with the RC circuit?
-The first example demonstrates transient analysis of an RC circuit, which examines the time-domain response of the circuit to an applied input voltage.
What are the key parameters set for the voltage source in the RC circuit simulation?
-The voltage source in the RC circuit simulation is set as a pulse waveform with a rise time of 1 nanosecond, fall time of 1 nanosecond, an on time of 10 milliseconds, a period of 20 milliseconds, and 10 cycles.
How do you change the frequency range in the AC analysis of LTSpice?
-In the AC analysis, you can set the frequency range by defining the start and stop frequencies. For example, you can set the start frequency to 1 Hz and stop at 1 MHz, with a specified number of points per decade.
What is the difference between the solid and dotted lines in the AC analysis plot?
-In the AC analysis plot, the solid line represents the voltage amplitude in dB, while the dotted line represents the phase shift of the signal at various frequencies.
How does LTSpice handle DC operating point analysis?
-For DC operating point analysis, LTSpice calculates the voltage and current at various nodes in the circuit. It provides the voltage at different points in the circuit and the current through the components, such as resistors and capacitors.
Outlines

此内容仅限付费用户访问。 请升级后访问。
立即升级Mindmap

此内容仅限付费用户访问。 请升级后访问。
立即升级Keywords

此内容仅限付费用户访问。 请升级后访问。
立即升级Highlights

此内容仅限付费用户访问。 请升级后访问。
立即升级Transcripts

此内容仅限付费用户访问。 请升级后访问。
立即升级浏览更多相关视频

LTSPICE Tutorial - Transient Simulation with RC Circuit

Controlling Led brightness using PWM signal | tinkercad | in Hindi

Electrical Engineering: Basic Laws (18 of 31) Finding the Equivalent Resistor Ex. 3

Hukum 2 kirchoff rangkaian 2 loop
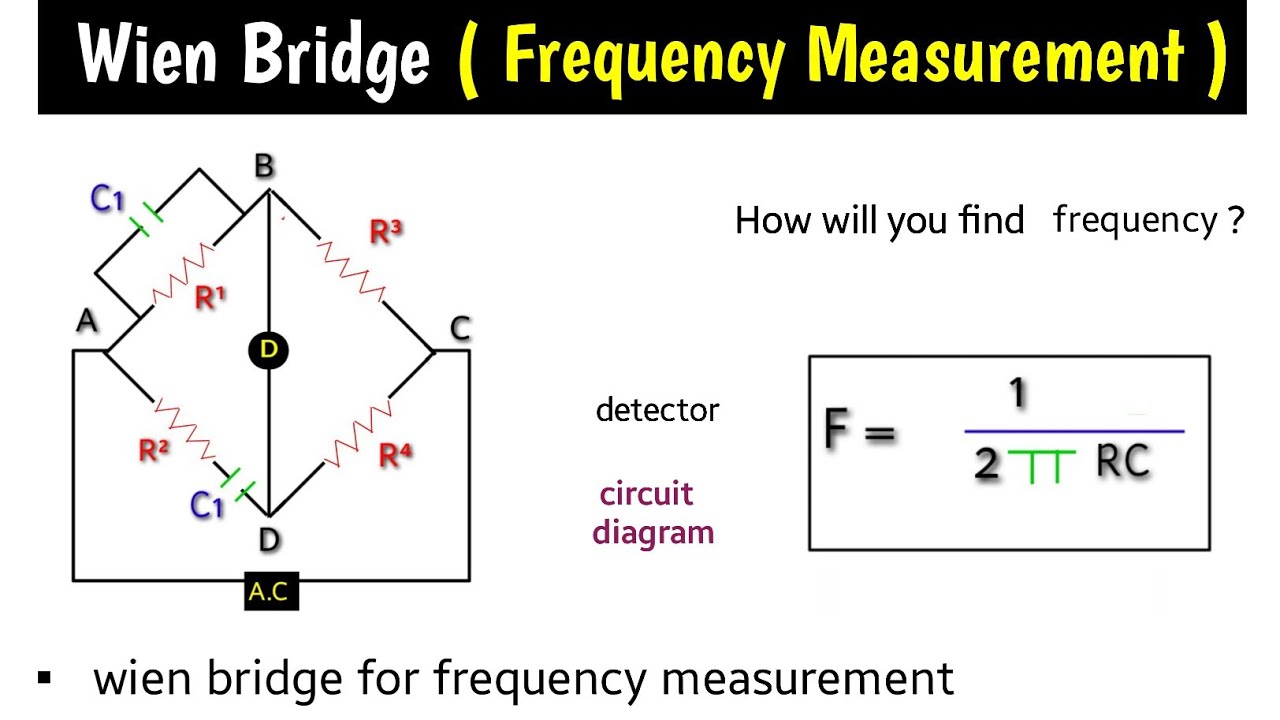
wien bridge |frequency measurement by Wien bridge | Wiens bridge in hindi | wien's bridge | formula
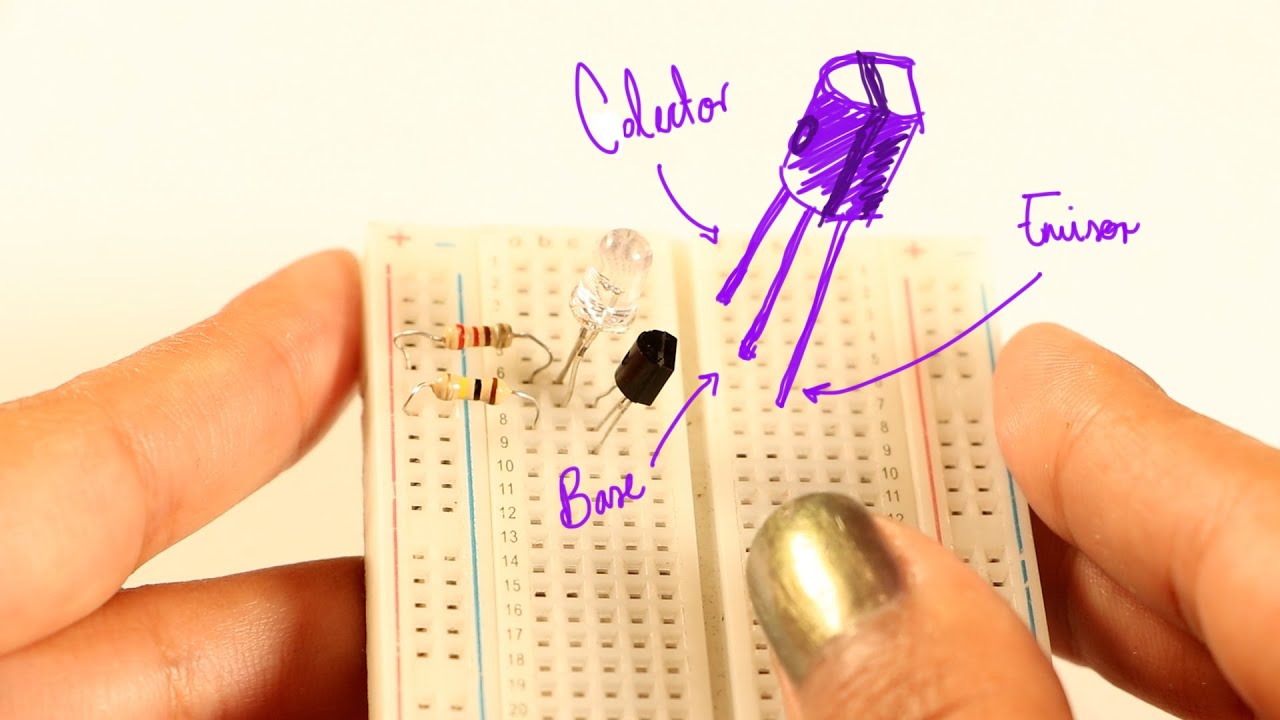
Como HACER un SENSOR de OSCURIDAD con LDR + TRANSISTOR
5.0 / 5 (0 votes)
