Cara Menghitung Analisis Regresi Sederhana secara Manual
Summary
TLDRIn this educational video, the presenter explains how to manually perform simple linear regression analysis, emphasizing its use in predicting one variable based on another. The video covers key concepts such as the difference between correlation and regression, the assumptions for regression analysis, and step-by-step instructions for calculating the regression equation. The presenter also demonstrates how to apply the model, interpret regression results, and evaluate the significance of the regression using the F-test. This tutorial provides a thorough understanding of regression analysis for data analysis and research purposes.
Takeaways
- 😀 The video explains how to manually calculate simple linear regression, which is used to predict one variable based on another.
- 😀 Linear regression can be used for prediction, unlike correlation, which only assesses the strength of relationships between variables.
- 😀 The independent variable (X) is used to predict the dependent variable (Y), and the prediction is based on a regression equation.
- 😀 Before performing a regression analysis, certain assumptions must be met: variables must be measured on an interval or ratio scale, the relationship must be linear, and the data should be normally distributed without significant outliers.
- 😀 The regression analysis produces key results, including the regression equation, significance of the equation, regression line, correlation coefficient, and coefficient of determination.
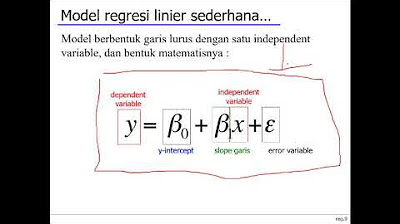
- 😀 The basic formula for a regression equation is: Y = a + bX, where 'a' is the intercept and 'b' is the slope.
- 😀 The script uses an example dataset to demonstrate how to calculate the regression equation, finding the values for 'a' and 'b'.
- 😀 The significance of the regression equation is tested using the F-test, which compares the calculated F-value (F hitung) with a critical F-value (F tabel) to assess whether the regression is statistically significant.
- 😀 A significant regression equation allows predictions, for example, predicting student learning outcomes based on critical thinking scores.
- 😀 The video demonstrates how to calculate the ANOVA summary table for regression, which involves calculating total, regression, and error (residual) sums of squares, degrees of freedom, mean squares, and the F-value.
- 😀 The key takeaway is that if the F-hit result is greater than the F-table result, the regression equation is significant, meaning the predictor variable (X) can significantly predict the outcome variable (Y).
Q & A
What is the main focus of this video?
-The video focuses on explaining how to manually perform simple linear regression analysis, including calculating the regression equation and testing its significance using the F-test.
What is simple linear regression used for?
-Simple linear regression is used to predict the value of a dependent variable based on the value of an independent variable, aiming to establish a predictive relationship between them.
How does regression differ from correlation analysis?
-While correlation analysis only measures the strength and direction of a relationship between two variables, regression analysis goes a step further by allowing prediction of one variable based on the other.
What are the assumptions that must be met before conducting simple linear regression analysis?
-The assumptions include: both variables must be measured on an interval or ratio scale, the relationship between them must be linear, there should be independence of observations, no significant outliers, and the data should follow a normal distribution with homoskedasticity.
What are the four main pieces of information reported in regression analysis?
-The four key pieces of information are: the regression equation, the significance of the regression equation, the regression line (visualized as a graph), and the correlation and determination coefficients.
What does the regression equation represent?
-The regression equation, typically written as Y = a + bX, represents the predicted value of the dependent variable (Y) based on the value of the independent variable (X), with 'a' being the intercept and 'b' the slope.
How do you calculate the regression coefficients (a and b)?
-To calculate the coefficient 'a', the formula involves summing certain products and squares of X and Y values. For 'b', you use the formula that involves summing the products of X and Y and dividing by the sum of squares of X values. The coefficients are then plugged into the regression equation.
What is the significance of the F-test in regression analysis?
-The F-test is used to determine the overall significance of the regression model. It tests whether the regression equation provides a better fit to the data than a model with no predictors, with a higher F-value indicating that the regression is statistically significant.
What does it mean if the calculated F-value (F hitung) is greater than the F-table value (F tabel)?
-If the calculated F-value is greater than the F-table value, it means that the regression model is statistically significant, meaning the independent variable (X) can reliably predict the dependent variable (Y).
How do you predict values using the regression equation?
-Once the regression equation is determined, you can predict the value of the dependent variable (Y) by substituting a given value of the independent variable (X) into the equation. For example, if X = 7, you would plug this into the equation to calculate the predicted Y value.
Outlines

此内容仅限付费用户访问。 请升级后访问。
立即升级Mindmap

此内容仅限付费用户访问。 请升级后访问。
立即升级Keywords

此内容仅限付费用户访问。 请升级后访问。
立即升级Highlights

此内容仅限付费用户访问。 请升级后访问。
立即升级Transcripts

此内容仅限付费用户访问。 请升级后访问。
立即升级浏览更多相关视频

Regresi dan Korelasi Sederhana
Week 6 Statistika Industri II - Analisis Regresi (part 1)

PERBEDAAN REGRESI LINEAR SEDERHANA DAN REGRESI BERGANDA
Simple Linear Regression Simplified | Orange Data Mining Tutorial

[python] Program Regresi Linear Sederhana

Cara Analisis Regresi Linear Sederhana dengan Jamovi
5.0 / 5 (0 votes)
