Pengertian Statistik dan Statistika, Perbedaan, dan Contohnya
Summary
TLDRIn this video, the host introduces the concepts of statistics ('statistik') and statistical science ('statistika'). While 'statistik' refers to the collected data and its various forms like narratives, graphs, and infographics, 'statistika' is the process or methodology used to gather, analyze, and interpret this data. The host explains the steps involved in statistical analysis, from data collection to presentation. Visual aids such as charts and infographics are used to make complex data more understandable. The video emphasizes the importance of both concepts in research and real-world analysis.
Takeaways
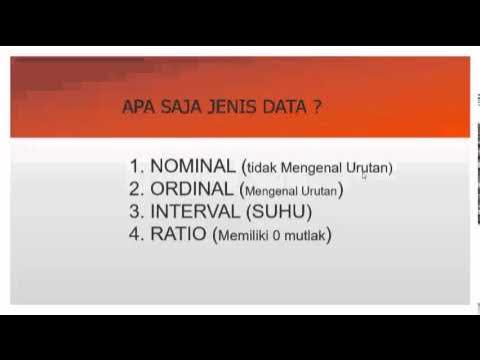
- 😀 Statistics is a collection of data analyzed from specific events or phenomena.
- 😀 Statistika refers to the process of collecting, organizing, analyzing, and interpreting data.
- 😀 Statistical data can be presented in various formats such as narratives, graphs, or infographics.
- 😀 A key difference between statistics and statistika: Statistics is the data, while statistika is the process of working with the data.
- 😀 Examples of statistics include data on population growth, unemployment rates, and sports statistics.
- 😀 Narrative data presents statistical information in descriptive text form.
- 😀 Graphs and diagrams are visual representations of statistical data over time or comparisons.
- 😀 Infographics simplify and visually represent statistical data for better understanding.
- 😀 Statistika follows a methodology that includes data collection, data processing, analysis, and presentation.
- 😀 The video encourages viewers to engage in discussions and subscribe to the channel for further learning.
- 😀 The channel is focused on explaining statistical concepts and methods in an accessible way for beginners.
Q & A
What is the difference between statistics and statistika?
-Statistics refers to the data collected and analyzed from specific events or phenomena, while statistika refers to the scientific methodology or process used to collect, organize, analyze, and interpret this data to derive meaningful conclusions.
How is statistics presented in different formats?
-Statistics can be presented in various formats, such as narrative descriptions, graphical diagrams, and infographics. Each format helps in visualizing and interpreting data in ways that make it easier to understand.
Can you give an example of statistics mentioned in the video?
-One example given in the video is a survey about the understanding and implementation of Pancasila values among the youth. The survey showed that a significant percentage of youth were unaware of these values, which was presented as statistical data.
What is the role of statistika in research?
-Statistika plays a crucial role in research as it provides the methodologies and techniques needed to collect, organize, and analyze data. It allows researchers to draw meaningful conclusions and make informed decisions based on the data.
What are some common methods used in statistika for analyzing data?
-Common methods in statistika include data collection techniques (surveys, experiments), data organization (sorting and structuring data), data analysis (statistical tests, modeling), and data interpretation (drawing conclusions from the analysis).
How does the process of statistika relate to methodology in scientific research?
-Statistika is an integral part of the scientific research methodology, as it provides the tools for collecting data, analyzing it systematically, and interpreting the results to support or refute hypotheses.
What is an example of data presented in the form of a graph?
-An example of statistical data presented in the form of a graph is the diagram showing the number of students enrolled in a particular department from 2012 to 2017, illustrating the growth or decline in student numbers over time.
Why is it important to use different forms of data presentation?
-Using different forms of data presentation, like narratives, diagrams, and infographics, helps make complex information easier to understand, allowing viewers to interpret and analyze the data more effectively.
What are the benefits of using infographics in presenting statistical data?
-Infographics are useful because they present statistical data visually, making it easier for viewers to grasp key trends and insights at a glance. They combine graphics with concise data, enhancing comprehension and engagement.
What was the significance of the Pancasila survey example shared in the video?
-The Pancasila survey highlighted the low level of understanding among youth regarding the Pancasila values, with only 9.4% of respondents able to recall the contents of the Sumpah Pemuda. This example showed how statistical data can reflect societal issues and provide insights into cultural or educational gaps.
Outlines

此内容仅限付费用户访问。 请升级后访问。
立即升级Mindmap

此内容仅限付费用户访问。 请升级后访问。
立即升级Keywords

此内容仅限付费用户访问。 请升级后访问。
立即升级Highlights

此内容仅限付费用户访问。 请升级后访问。
立即升级Transcripts

此内容仅限付费用户访问。 请升级后访问。
立即升级


5.0 / 5 (0 votes)
