[python] Program Regresi Linear Sederhana
Summary
TLDRIn this video, the presenter explains how to calculate a simple regression equation using Python. The tutorial covers the process of importing necessary libraries, handling data from a CSV file, and visualizing it using graphs. The presenter also demonstrates calculating constants and correlation coefficients manually, then shows how Python's built-in libraries simplify these tasks. The video includes a practical example of predicting weight based on calorie intake, and concludes with an explanation of how to use tables for coefficient calculation, providing a comprehensive guide for beginners interested in regression analysis with Python.
Takeaways
- 😀 Import necessary libraries such as pandas, matplotlib, and sklearn for linear regression and data visualization.
- 😀 Load the dataset from a CSV file containing caloric intake and body weight data.
- 😀 Prepare the data by separating the independent variable (calories) and the dependent variable (body weight).
- 😀 Plot a scatter graph to visualize the relationship between caloric intake and body weight.
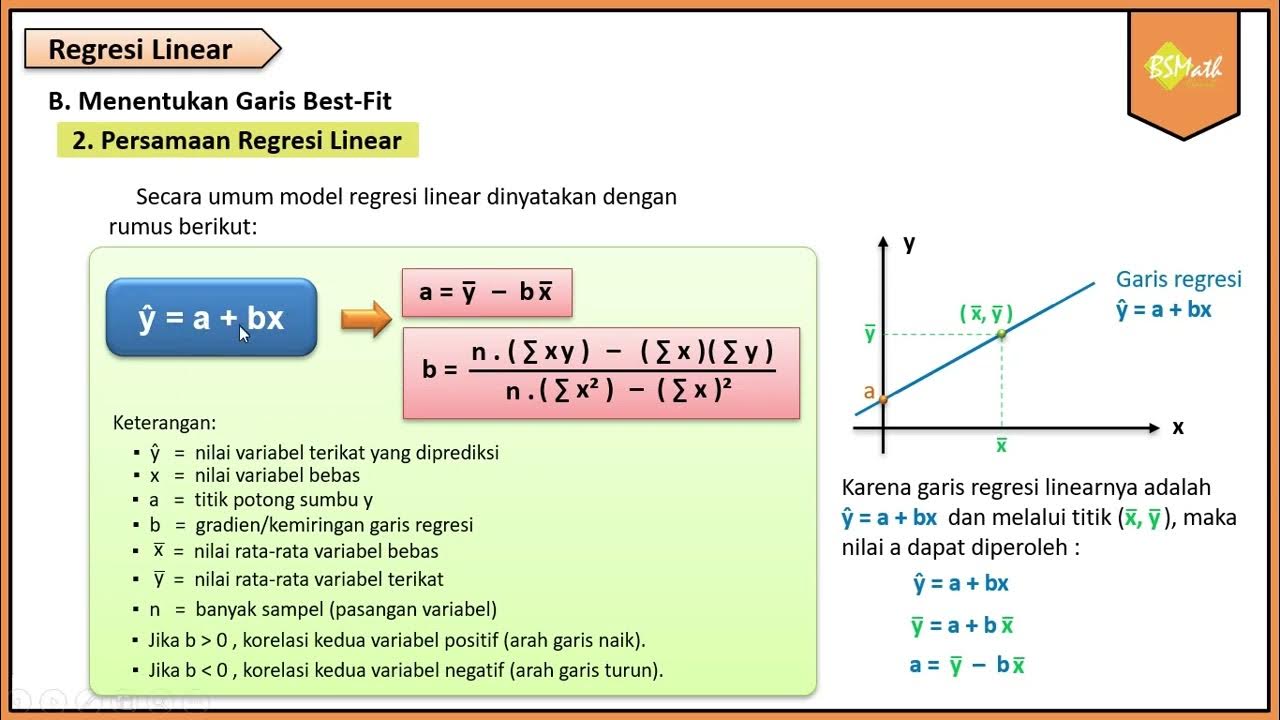
- 😀 Manually calculate the regression coefficients (a and b) and the correlation coefficient (r) using formulas.
- 😀 Compute the R-squared (R²) value to assess the goodness of fit for the regression model.
- 😀 Use Python's sklearn library to perform linear regression automatically and compare the results with manual calculations.
- 😀 Predict body weight based on caloric intake using the regression model.
- 😀 Demonstrate how to input custom data (caloric intake) and predict corresponding body weight using the trained model.
- 😀 Discuss the option of using a table for manual calculations, although it is not necessary with Python's built-in functions.
Q & A
What is the purpose of the tutorial in the video?
-The tutorial demonstrates how to solve a simple regression equation using Python and apply it to predict weight based on daily calorie intake.
What libraries are imported in the Python code for this regression analysis?
-The libraries imported are pandas (for data manipulation), matplotlib (for plotting graphs), and sklearn (for regression modeling).
How is the data loaded into the Python program?
-The data is loaded from a CSV file using pandas' `read_csv` function, which reads the file and stores it in a DataFrame.
What are the variables assigned in the code for regression analysis?
-The variables `x` and `y` are assigned to the 'calories' and 'weight' columns of the DataFrame, respectively.
How does the tutorial visualize the data?
-The data is visualized by plotting a scatter plot using the matplotlib library, with 'calories' on the x-axis and 'weight' on the y-axis.
What constants are calculated in the regression analysis?
-The constants calculated are the slope (b), intercept (a), and the R-squared value, which indicates the strength of the linear relationship between calories and weight.
How are the regression constants calculated manually in the script?
-The constants are calculated manually using formulas for the slope (b) and intercept (a) based on the data, and the R-squared value is computed for correlation analysis.
What is the advantage of using the sklearn library for regression?
-Using sklearn simplifies the regression process, as it automatically calculates the slope, intercept, and R-squared values, saving time and reducing the complexity of manual calculations.
How does the Python code predict weight based on daily calorie intake?
-The code predicts weight by taking an input for daily calorie intake, then applying the regression formula: `y = a + b * x`, where 'a' is the intercept, 'b' is the slope, and 'x' is the input calorie value.
What is the role of the data table mentioned in the video?
-The data table is used to assist in manually calculating the regression constants, although the tutorial shows that this can be bypassed by using the `sklearn` model for efficiency.
Outlines

此内容仅限付费用户访问。 请升级后访问。
立即升级Mindmap

此内容仅限付费用户访问。 请升级后访问。
立即升级Keywords

此内容仅限付费用户访问。 请升级后访问。
立即升级Highlights

此内容仅限付费用户访问。 请升级后访问。
立即升级Transcripts

此内容仅限付费用户访问。 请升级后访问。
立即升级浏览更多相关视频

Cara Menghitung Analisis Regresi Sederhana secara Manual

Uji Regresi Linier Sederhana Dengan SPSS | Pembahasan Lengkap!

Metode Statistika | Analisis Regresi Linier | Part 1 Menentukan Persamaan Regresi

Data Mining 10 - Estimation (Linear Regression)

Regresi Resisten (Garis Resisten)

Persamaan Regresi Linear - Matematika Wajib SMA Kelas XI Kurikulum Merdeka
5.0 / 5 (0 votes)
