Secret 1 minute trick and 100% accuracy indicators | Pocket option strategy
Summary
TLDRIn this trading tutorial, the instructor demonstrates a practical strategy using the Zigzag Indicator, Keltner Channel, and Stochastic Oscillator to identify profitable entry points in 1-minute trades. The video guides viewers through setting up indicators, observing candle movements, and interpreting signals for optimal timing. Key tips include recognizing extreme points, tracking candle momentum, and confirming trends with stochastic line crossings. The method emphasizes simplicity and accuracy, allowing traders to make informed decisions while monitoring short-term market movements. By following these steps, viewers can enhance their online trading skills and increase their chances of successful trades.
Takeaways
- 😀 The video demonstrates a trading strategy using Zigzag, Keltner Channel, and Stochastic Oscillator indicators.
- 😀 Zigzag indicator settings are 5, 13, and 3 periods with a yellow line to track extreme points.
- 😀 Keltner Channel is set with periods 21, 9, 2, all lines colored white and made thicker for clarity.
- 😀 Stochastic Oscillator uses default periods with blue and white middle lines, green upper line, and red lower line.
- 😀 The chart uses 30-second Japanese candles, and each trade lasts 1 minute.
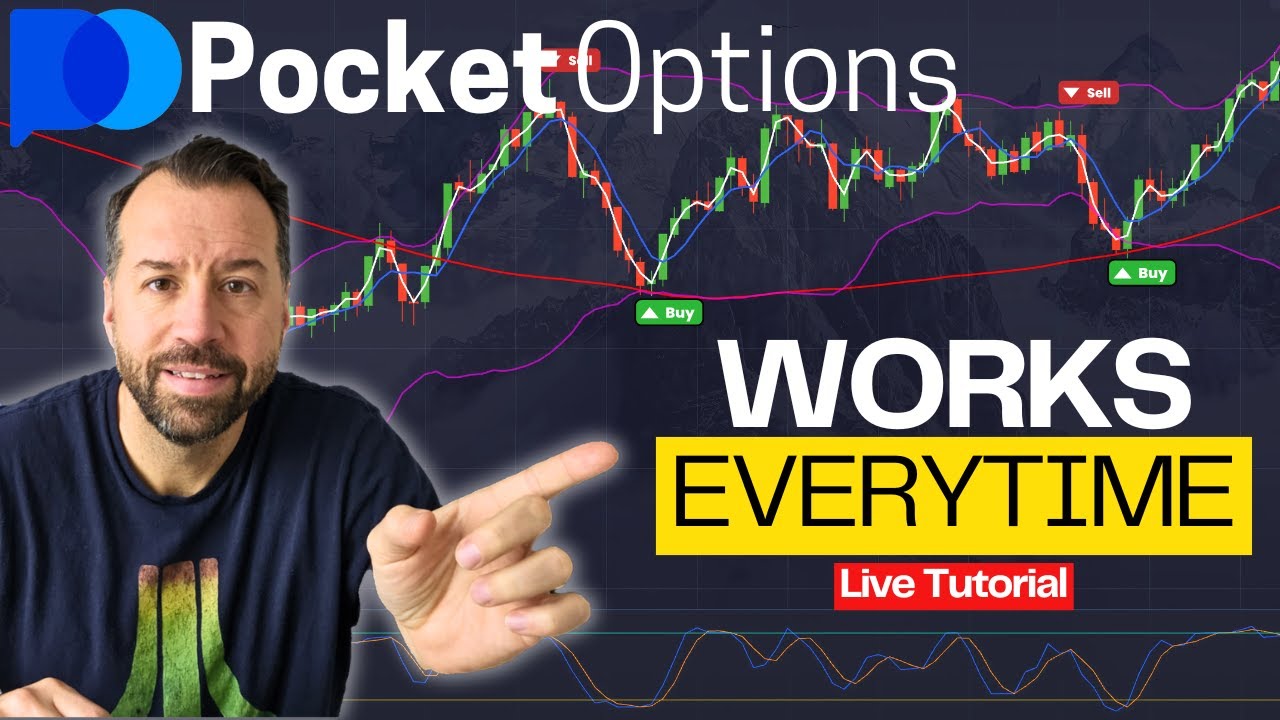
- 😀 The strategy focuses on watching if candles approach the middle line of the Keltner Channel as an initial signal.
- 😀 Stochastic Oscillator line crossings are used to confirm trade entry and exit points.
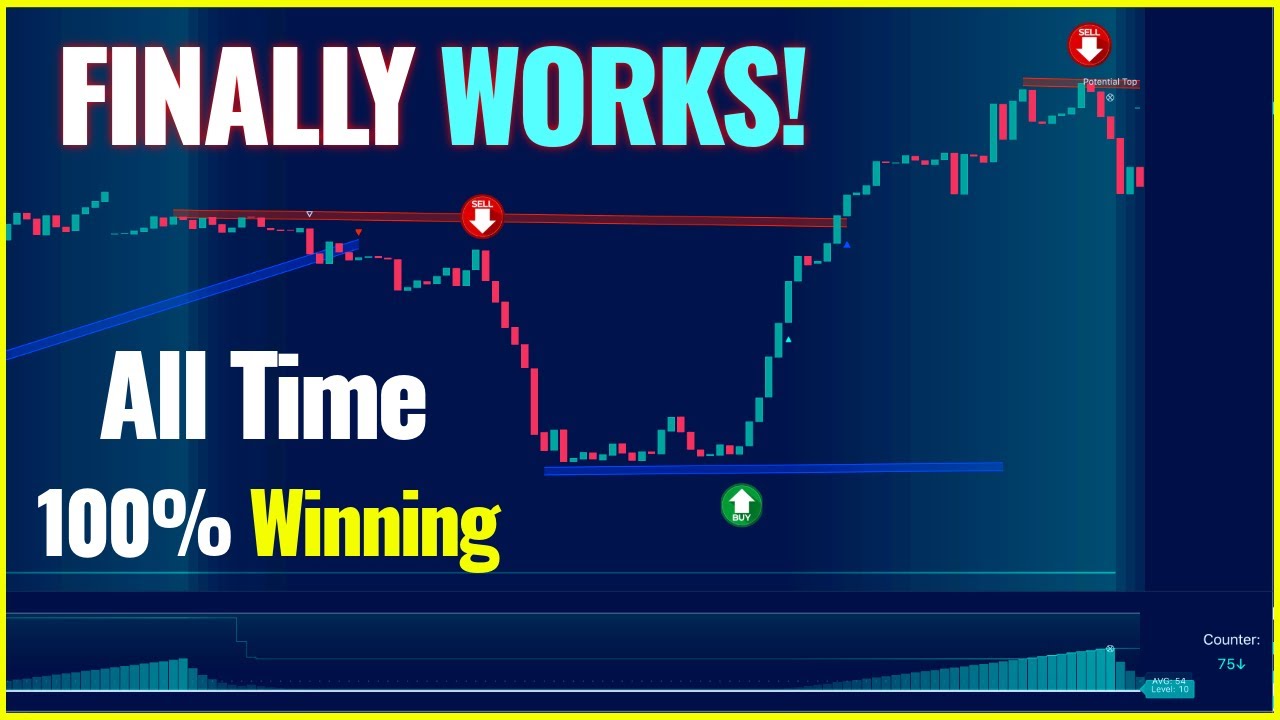
- 😀 Extreme points are identified by the upper white line of the Keltner Channel and the yellow Zigzag line to anticipate reversals.
- 😀 Multiple trades are taken when red or green candles form from extreme points, increasing the likelihood of continued movement in that direction.
- 😀 The method emphasizes patience, careful observation of signals, and combining multiple indicators for accurate trading decisions.
- 😀 The video concludes with a reminder that platform registration links are provided for viewers interested in practicing this strategy.
Q & A
What is the primary purpose of the video?
-The primary purpose of the video is to share trading tips and strategies using specific indicators to improve success in online trading.
What are the three indicators used in the trading method described?
-The three indicators used are the Zigzag, Keltner Channel, and Stochastic Oscillator.
What are the specific periods set for the Zigzag and Keltner Channel indicators?
-The periods set for the Zigzag indicator are 5, 13, and 3. For the Keltner Channel, the periods are set to 21, 9, and 2.
How are the indicator lines customized in the video?
-All the indicator lines are made white and are thickened to make them more visible.
What color scheme is used for the Stochastic Oscillator lines?
-The middle lines of the Stochastic Oscillator are blue and white. The upper line is green, and the lower line is red.
What trading time and candle type are used in the method?
-The method uses 30-second Japanese candles with a trading time of 1 minute.
How does the video suggest identifying a good trading moment?
-A good trading moment is identified when red or green candles are approaching the middle line of the Keltner Channel, followed by signals from the other indicators, such as the Stochastic Oscillator crossing over.
What is the significance of the Zigzag indicator in the trading strategy?
-The Zigzag indicator helps identify extreme points in the market, signaling when candles might reverse direction, which aids in predicting potential trend changes.
What does it mean when red candles cross the white middle line of the Keltner Channel?
-When red candles cross the white middle line of the Keltner Channel, it suggests a continuation of the downward movement, signaling a potential sell opportunity.
What is the key trick for determining when the candles may reverse direction?
-The key trick is to observe when the red candles cross the white line of the Keltner Channel and touch the yellow line of the Zigzag indicator, signaling that the price may start moving in the opposite direction.
What happens when two or three red candles form from an extreme point in a downward direction?
-If two or three red candles form from an extreme point in a downward direction, it indicates a high likelihood that the downward movement will continue, providing a strong selling signal.
What is the final takeaway message from the video?
-The final takeaway is to observe market indicators carefully, especially the Keltner Channel and Zigzag indicator, to identify entry points with strong signals, ensuring a higher chance of successful trades.
Outlines

此内容仅限付费用户访问。 请升级后访问。
立即升级Mindmap

此内容仅限付费用户访问。 请升级后访问。
立即升级Keywords

此内容仅限付费用户访问。 请升级后访问。
立即升级Highlights

此内容仅限付费用户访问。 请升级后访问。
立即升级Transcripts

此内容仅限付费用户访问。 请升级后访问。
立即升级浏览更多相关视频

It's Impossible to Lose with THIS Strategy! It Almost Always Wins!
This One Trading Strategy Works Everyday (Simple, Easy & Proven)

15 Best Trading Indicators on Pocket Option

Strategi Scalping Gold M1 Super Profit | Backtest 100x | Scalping Gold 1 Menit | Scalping XAUUSD
1 TBT BigBeluga Indicator, 3 Uses! Most Powerful Trading Tool Ever Created
🤑50 RSI Strategy FULL EXPLANATION! - EASIEST Binary Options Strategy for FULLY Beginners in 2024😬
5.0 / 5 (0 votes)
