La Estrategia De Trading Con MACD Perfecta Para Principiantes
Summary
TLDRThis video explains a simple yet effective MACD trading strategy tailored for beginners, allowing trading on any asset and timeframe. The strategy focuses on three key steps: adding the MACD indicator, understanding its three components (MACD line, signal line, histogram), and using a 100-period exponential moving average to determine trade direction. It emphasizes buying only above the EMA and selling below it, with clear entry, stop loss, and take profit rules. The video also highlights common mistakes traders make with MACD and hints at an advanced step for higher profitability, inviting viewers to comment if they want a follow-up tutorial.
Takeaways
- 📈 The video explains a simple MACD trading strategy designed for beginners that works on any asset and timeframe.
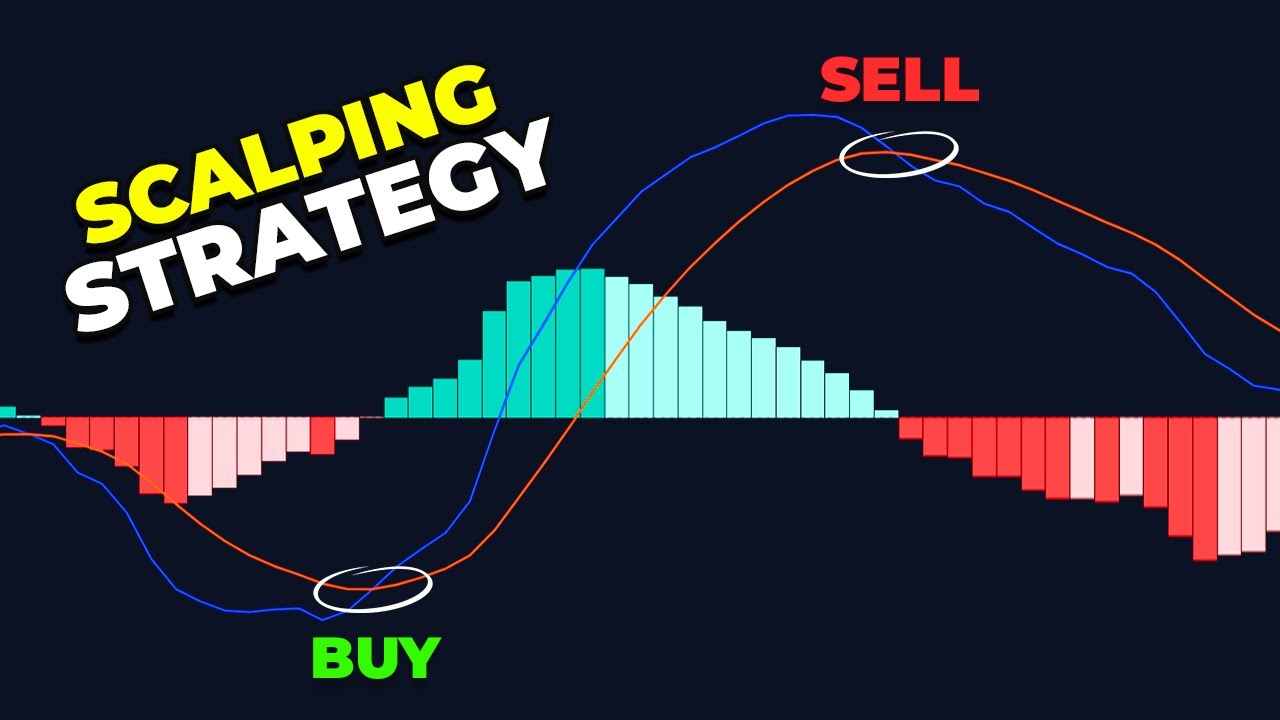
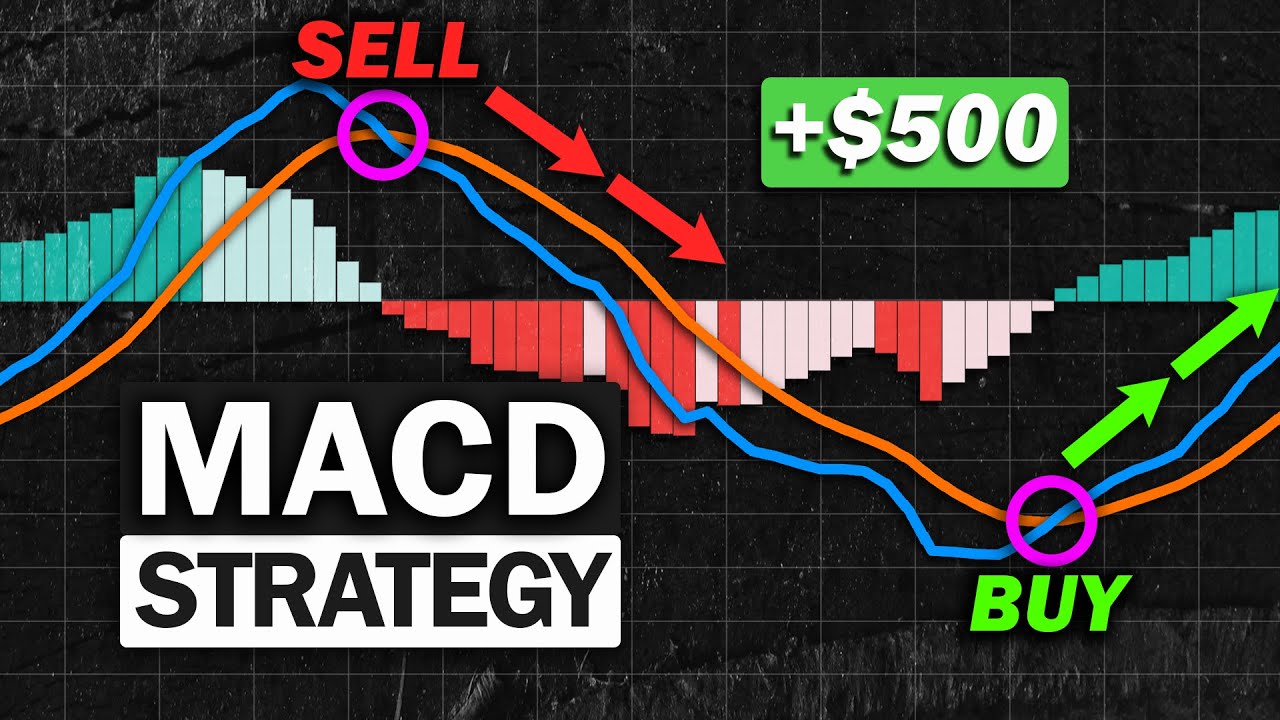
- 🔹 MACD stands for Moving Average Convergence Divergence, calculated as EMA 12 minus EMA 26, with a signal line EMA 9 and a histogram showing their difference.
- 🟢 When the MACD line and signal line are above zero, the trend is typically upward; when below zero, the trend is downward.
- ⚠️ Many traders fail with MACD because they trade in non-trending markets or rely on MACD alone without additional filters.
- 🟡 Adding a 100-period EMA helps filter trades: only consider buys when price is above EMA 100 and only sells when price is below EMA 100.
- ✖️ Entry signals occur when the MACD line crosses the signal line: upwards for buys above EMA 100, downwards for sells below EMA 100.
- 🛑 Stop loss should be placed just above or below the EMA 100, depending on whether it's a sell or buy trade.
- 💰 Recommended take profit ratios are between 1:1 and 2:1, with 2:1 suggested for beginners.
- 📊 Using MACD with EMA 100 avoids false signals during sideways or non-trending markets, increasing trade reliability.
- 🚀 The strategy is scalable: advanced traders can add an extra step to increase risk-reward and accuracy, which will be explained in a follow-up video.
Q & A
What does MACD stand for and what is its purpose in trading?
-MACD stands for Moving Average Convergence Divergence. It is a trend-following momentum indicator that shows the relationship between two moving averages of a security’s price, helping traders identify potential buy or sell signals.
What are the three main components of the MACD indicator?
-The three main components are: 1) the MACD line (calculated as the 12-period EMA minus the 26-period EMA), 2) the signal line (9-period EMA of the MACD line), and 3) the histogram (the difference between the MACD line and the signal line).
Why is it not recommended to trade directly using the 12 and 26-period EMAs instead of the MACD?
-Although the MACD is based on these EMAs, trading directly with them gives later signals. The MACD line crossing the signal line provides an earlier and more precise signal than the EMA cross on the chart, making it more effective for timing trades.
What are the two main ways to trade with MACD?
-1) Using MACD crossovers with the signal line (buy when MACD crosses above the signal line, sell when it crosses below). 2) Identifying divergences between price and the MACD (bullish or bearish divergences) to anticipate trend reversals.
Why do many traders fail when using MACD?
-Most traders fail because: 1) MACD is a trend-following indicator and is less effective in non-trending markets. 2) They use MACD signals without combining them with other tools or rules, resulting in subjective and weak strategies.
What is the first rule of the MACD trading strategy for beginners?
-Add a 100-period Exponential Moving Average (EMA) and only look for buy signals when the price is above this EMA, or sell signals when the price is below it. This helps filter trades based on the overall trend.
How is the second rule of the strategy applied?
-The second rule is to execute trades only when the MACD line crosses the signal line in the direction of the trend defined by the 100-period EMA. For example, buy only if the MACD crosses above the signal line when price is above the 100 EMA.
What is the recommended stop loss and take profit setup for this strategy?
-Place the stop loss just below (for buy) or above (for sell) the 100-period EMA. Set take profit using a risk-to-reward ratio of 1:1, 1.5:1, or 2:1 depending on the trader's preference and accuracy of the strategy.
Why is waiting for the correct MACD signal important even if the price is above or below the 100 EMA?
-Because premature trades may occur if the MACD crossover does not align with the trend. Waiting ensures that trades follow the trend and reduces the risk of false signals, increasing the probability of profitable trades.
Is there a way to enhance this beginner MACD strategy for more advanced traders?
-Yes. Advanced traders can add extra steps to improve the risk-to-reward ratio and accuracy, such as combining MACD with additional technical analysis, dynamic take profits, or more complex trend filters. However, these steps require deeper understanding and experience.
Outlines

此内容仅限付费用户访问。 请升级后访问。
立即升级Mindmap

此内容仅限付费用户访问。 请升级后访问。
立即升级Keywords

此内容仅限付费用户访问。 请升级后访问。
立即升级Highlights

此内容仅限付费用户访问。 请升级后访问。
立即升级Transcripts

此内容仅限付费用户访问。 请升级后访问。
立即升级浏览更多相关视频

My Stupid Easy 2 Minute Scalping Strategy To Make $15K/Week

2025 FRESH MACD Buy and Sell 1 minute Scalping | Buy and Sell Indicator
BEST MACD Trading Strategy For Scalping (Simple & Profitable)
BEST 5 Minute Crypto Scalping Strategy (Simple)
Most Effective MACD Strategy for Daytrading Crypto, Forex & Stocks (High Winrate Strategy)

SCALPING XAUUSD WIN RATE TINGGI DENGAN 1 POLA INI
5.0 / 5 (0 votes)
