Rápido e Fácil | Função do 1º grau | Função afim
Summary
TLDRThis script delves into the concept of functions and their applications, using a factory's cost structure as an example. It explains how a fixed cost plus a variable cost per unit forms a first-degree function, illustrating the linear relationship between cost and production quantity. The script guides through the process of identifying the function's domain and range, and how to derive the function's formula from real-world data. Practical examples and a step-by-step approach make the abstract concept of first-degree functions tangible and applicable.
Takeaways
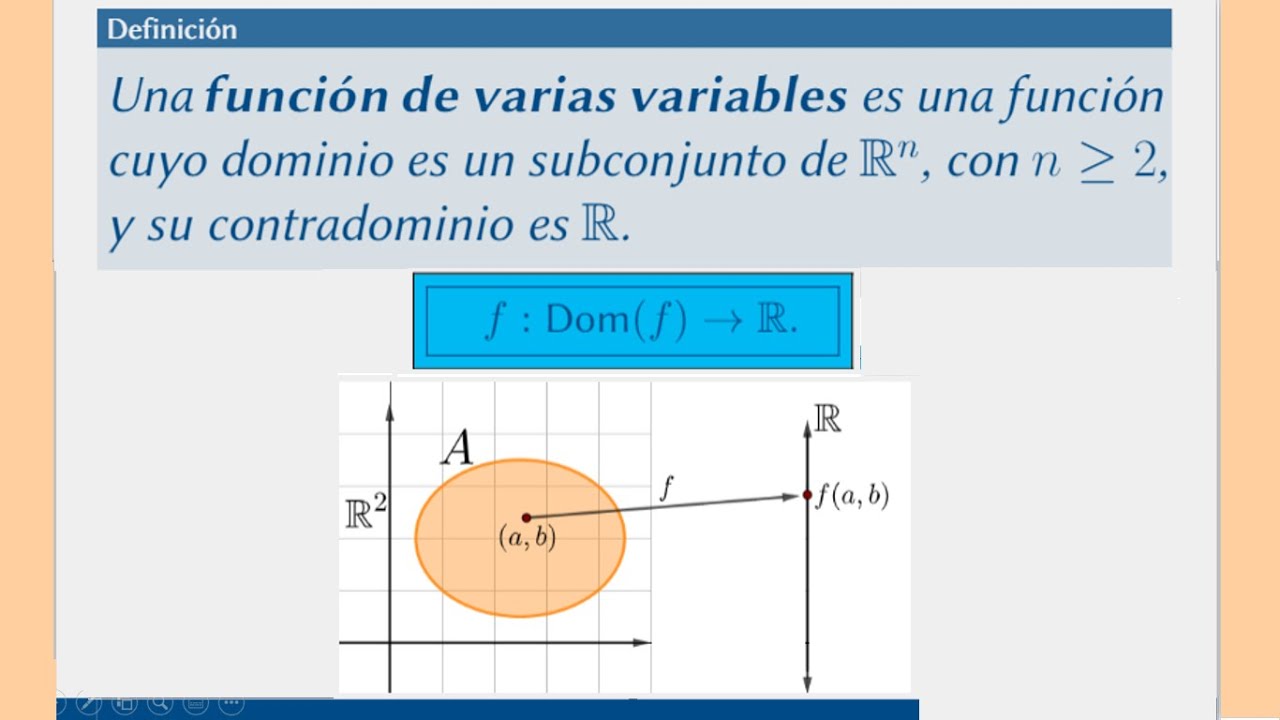
- 😀 A function is a mathematical relationship between two sets where one set of values (domain) generates another set of values (image).
- 🔍 The domain of a function consists of the input values that generate the output, while the image represents the resulting values.
- 📚 The concept of function is crucial in mathematics, especially in understanding the relationship between input and output sets.
- 📈 The script provides an example of a linear function, which is a first-degree function, with a cost function in a production scenario.
- 💰 The cost function includes a fixed cost plus a variable cost per unit produced, which is a common model in economics and business.
- 📉 The fixed cost is independent of the number of units produced, while the variable cost changes linearly with the number of units.
- 📝 The script explains how to derive the cost function by identifying the fixed and variable costs and their relationship to the number of units produced.
- 📊 The process of graphing a linear function is demonstrated, showing how to plot points and draw the line that represents the function.
- 🔢 The script also covers how to find the slope (angular coefficient) and y-intercept (linear coefficient) of a linear function from a graph.
- 📌 Understanding the slope and y-intercept is essential for determining the equation of a linear function, which can then be used to predict costs or other outcomes.
- 🎓 The explanation is aimed at helping learners grasp the concept of functions, particularly first-degree functions, and their practical applications.
Q & A
What is the basic concept of a function in the context of sets?
-A function represents a relationship between two sets where each element from the first set (domain) is associated with exactly one element in the second set (image).
What is the domain of a function?
-The domain of a function is the set of all possible input values (elements from set A) that are used to generate the output values (elements from set B).
What is the image of a function?
-The image of a function is the set of all output values that result from applying the function to each element of the domain.
What is the difference between the domain and the codomain of a function?
-The domain is the set of inputs for the function, while the codomain is the set of all possible outputs, which includes the actual image of the function.
How is the cost function of a production process described in the script?
-The cost function is described as having a fixed cost plus a variable cost per unit produced, where the total cost is calculated by adding the fixed cost to the variable cost multiplied by the number of units produced.
What is the fixed cost in the production cost function mentioned in the script?
-The fixed cost in the production cost function is 40 reais, which is the cost that does not depend on the number of units produced.
What is the variable cost per unit in the production cost function?
-The variable cost per unit is 10 reais, which is added to the total cost for each unit produced.
How can you determine the total cost of producing a certain number of units using the given cost function?
-To determine the total cost, multiply the number of units produced by the variable cost per unit and then add the fixed cost.
What is the practical example given in the script to illustrate the application of a first-degree function?
-The practical example is a factory with a fixed cost of 40 reais and a variable cost of 10 reais per unit produced, where the function is used to calculate the total cost based on the number of units produced.
How does the script explain the process of graphing a first-degree function?
-The script explains graphing by identifying points on the graph, such as the fixed cost point when no units are produced, and then using two points to draw the line that represents the first-degree function.
What is the significance of the slope in the context of a first-degree function?
-The slope in a first-degree function represents the rate of change of the dependent variable (cost) with respect to the independent variable (number of units produced), indicating how much the cost increases for each additional unit.
How can you find the equation of a first-degree function from a graph?
-You can find the equation by identifying two points on the line, calculating the slope (change in y over change in x), and then using one of the points to solve for the y-intercept (b) in the equation y = mx + b.
What is the cost of producing 30 units according to the script's example?
-The cost of producing 30 units is 340 reais, calculated as 10 times 30 (for the variable cost) plus the fixed cost of 40 reais.
Outlines
📚 Introduction to Functions and Their Basic Concepts
This paragraph introduces the concept of a function as a relationship between two sets. It explains that a function is a rule that assigns each element from the domain set (A) to exactly one element in the image set (B). The paragraph uses an example to illustrate how a value from set A generates a corresponding value in set B. It also discusses the domain and image of a function, clarifying that the domain consists of the values that generate the image, while the image consists of the values being generated. Additionally, it touches on the idea of a function's formula, which is used to determine the output (y) based on the input (x), and introduces the concept of a linear function as an example of a first-degree function.
🔢 Application of Linear Functions in Cost Calculation
The second paragraph applies the concept of a linear function to a practical scenario involving cost calculation in a manufacturing context. It describes a situation where there is a fixed cost plus a variable cost per unit produced. The paragraph formulates a linear function that represents the total cost as a function of the number of units produced, with the fixed cost being R$40 and the variable cost being R$10 per unit. It explains how to determine the cost of producing a certain number of pieces by substituting the number of units into the function. The paragraph also demonstrates how to calculate the cost for producing 30 pieces, resulting in a total cost of R$340, and briefly mentions the importance of understanding linear functions in various competitive exams and everyday life.
📈 Graphical Representation and Calculation of Linear Functions
This paragraph delves into the graphical representation of a linear function and the process of determining its equation from a graph. It explains how to find the slope (angular coefficient) of the line by using the change in y (delta y) over the change in x (delta x) between two points on the line. The paragraph provides a step-by-step method for calculating the slope using two given points on the graph and then uses this slope to formulate the equation of the line. It also discusses how to find the y-intercept (b) by substituting a point from the graph into the line's equation, solving for b. The paragraph concludes with an example of how to use the derived linear function to calculate the cost of producing a different number of pieces, emphasizing the linear growth of costs.
📝 Practical Example and Calculation of Production Costs
The final paragraph presents a practical example of calculating production costs using a linear function. It provides a scenario where the cost of producing nine pieces is to be determined. The paragraph shows the calculation process by substituting the number of pieces (x = 9) into the linear function equation derived earlier. It emphasizes the fixed cost component of the production, which remains constant regardless of the number of pieces produced, and calculates the total cost for producing nine pieces, which is R$85. The paragraph concludes with a summary of the steps involved in solving linear function problems, including finding the angular coefficient, linear coefficient, and using the function to make practical calculations.
Mindmap
Keywords
💡Function
💡Domain
💡Image
💡First-degree function
💡Coefficient
💡Fixed cost
💡Variable cost
💡Graph
💡Slope
💡Linear relationship
💡Production cost
Highlights
Introduction to the concept of a function as a relationship between two sets.
Explanation of domain and image in the context of functions.
Clarification of common confusion between domain and image in functions.
Illustration of how a function maps values from one set to another.
Example of a function with a simple addition operation to demonstrate the concept.
Discussion on the practical application of linear functions in daily life.
Introduction to the cost function in a production scenario with fixed and variable costs.
Derivation of the cost function formula based on the number of items produced.
Graphical representation of the cost function and its interpretation.
Explanation of the slope in the context of a linear function representing cost increase per unit.
Calculation of production cost for a specific number of items using the derived function.
Demonstration of how to graph a linear function using two points.
Finding the slope of a line given two points on the graph.
Determination of the y-intercept to complete the linear function equation.
Practical example of calculating production costs for different quantities using the linear function.
Emphasis on the importance of understanding the fixed cost in production scenarios.
Summary of the process to derive a linear function from a graph, including finding the slope and y-intercept.
Encouragement to apply the knowledge of linear functions to solve practical problems.
Transcripts
[Música]
beleza então vamos falar simplesmente de
função o que seria função a relação
entre dois conjuntos sandro dá um
exemplo tá aqui ó
eu escrevi pra você a uma função de a em
relação à mir são o que quer dizer a em
relação à dengue é o valor de agger anda
um valor de ler ou seja é um domingo
valor de x gerando um valor de isso uma
imagem perfeito france liga que não tem
conjunto ar e o conjunto b
olha quais são os valores que estão
gerando e quais estão sendo gerados
sandro e daí
e daí que a partir disso eu tenho uma
relação entre dois conjuntos e você pode
observar que o que está ocorrendo com
muita virando 6o 2 tabelando 7 o trem
está virando 8 se você pensar que está
sendo somaram que cinco unidades a cada
valor do conjunto a gerando um valor no
conjunto b então você já pegou que a
função é essa relação entre os dois
conjuntos onde um valor gera o outro mas
sandro quem gera keyframes na função
você tem um domínio a imagem eu
particularmente quando era união ficava
muito confuso nisso que eu passei a
fazer
eu sabia que tinha um x e tinha um y era
o domínio em outra imagem mas qual era
qual eu fazia assim ó imagem eu passei a
escrever imagem com y ea ong jovem não é
com isso então passei a fazer isso só
imagem e aí eu escrevi a imagem com y e
vai aguardar que imagem era um y bush
seria quem o domínio da função do efeito
frentes
então agora você já sabe quando eu pedir
a você e gatos 2 com josé essa relação é
entre a e b e eu pedir a você qual é o
domínio da função do domínio só
valores que estão gerando a imagem
o domínio dessa função seria se ele está
aqui o domínio 1 2 e 3 domínio da função
de a em relação à dengue
sandro e quem seria a imagem a imagem
está aqui ó imagens valor stimson imagem
os valores que foram gerados a partir do
domínio então eu tenho como imagens em
78 colocarei aqui ó imagem vai chamar de
n 6 7 e 8 sandro quem seria o contra o
domínio da relação de dois conjuntos da
relação de a atender aqui o contra o
domínio o que gera é o domínio o que é
gerado é a imagem e o contra domingo é
tudo o segundo conjunto todo conjunto
bem vai entrar no meu contra o domínio
então frei está aqui ó contra o domínio
6 7 8 e 10 com efeito trans
aí eu peço a você sandro tudo bem
domingo imagem contra o domínio eu já
aprendi mas aqui estão me pedir o
seguinte ela me dava essa relação que a
função de a em relação a dmp dia qual
era
além de formação da função qual era além
de formação da função além de formação
da função é a fórmula zinha que gera o y
né então eu tenho como ler informação
dessa função que y é obtido como pegando
o valor do domínio tel x e somando 5
unidade pra ele então pede é essa quinta
a lei de formação da função aqui da
função de a em relação a beber e isso
introdução de função pra gente decolar
agora em função do primeiro grau pega
essa presente comigo
junte uma ao topo valeu frente estão o
jonas fala francês função do primeiro
grau vamos ver um exemplo prático tac a
função de primeiro grau eu botei em
estar aqui ó
na prática porque na prática não poderia
começar falando y negócios mas lia
coeficiente acumular pode sentir linear
mas não vamos ver no dia a dia como é
usado que é assim que é cobrado no enem
fortemente colégio concurso em tudo
então daqui feliz vem comigo vou passar
pra cara tranquilão na produção de peças
uma fábrica tem um custo fixo de 40
reais mais um custo variável de 10 reais
por unidade produzida
eu falo se ão do ser o custo da produção
em reais e e eo número de peças
produzidas determine francês
a lei da função que que é isso a lei que
gera o custo em função do número de
peças vendidas
você pode deduzir isso sem pensar em
função primeiro léo sandro se ao custo
sim então custo
de acordo com o número de peças vendidas
será igual ao que ao valor fixo que é
quanto r$40 mais 10 reais a cada peça
vendida a sobra então tá aqui ó
quarenta reais mais de dez vezes o
número de peças vendidas perfeito frente
de acordo com o número de peças você
obtém um custo a única arrumação para
deixar o nitinho seria falar assim o
custo em função de m em função do número
de peças vendidas
isso é a estrutura da função de primeiro
grau a ação rescreve ela de uma forma
mais bonitinha só poderia cortar o custo
em função do número de peças vendidas é
igual a dez vezes n 10 do número de
peças porque que é 10 reais a cada peça
produzida mais 40 reais
fixo perfeito na função do primeiro grau
você vai aprender que aqui é o que a
taxa de variação é o coeficiente angular
no caso aqui a taxa de crescimento a
cada unidade o custo cresce 10 reais
sobre quem é o corpo sente linear
você vai ver o já viu que é o 40 é o
valor que não depende de che seu valor
time sozinho é a taxa fixa perfeitos
grandes seus pergunto qual é o custo da
produção de 30 peças quando eu pergunto
um custo de 30 peças você afirma que ele
que é o número de peças é igual a quanto
a 30
logo você substituindo 30 aquino enir
você obtém o custo em relação a 30 peças
que é dez vezes 30 porque cada peça
produzida r$10 tom dez meses 30 mais 40
o sandro já sei das vezes 30300 mais 40
o custo de 30 peças é igual a 340 reais
perfeito para a disfunção do primeiro
grau na veia aplicada numa questão do
cotidiano sandro vai em seu despediu
gráfico francês às vezes você nem vi o
gráfico ainda mais tá aqui ó
o eixo y eu vou falar que é o custo em
reais por peça produzida o eixo x eu vou
falar que a eni é o número de unidades
de peça produzida a sandra só aplicar
sinfra está aqui ó
se ele for 5 ou seja cinco peças
produzidas substituir aqui há cinco
vezes 1050 mais 40 o 5 vai ligar no novo
resultado aqui ó 50 mais 40 90 você tem
aqui um pontinho sandro faz mais um
pontinho assim vamos fazer a reta que o
gráfico
só o primeiro léo um exemplo aqui ó 30
peças 30 peças produzidas fizemos aqui
na galeria custo da quanto r$340 sobe
sobe sobe sobe marca lá no 340 reais
daqui outro pontinho ligando dois pontos
eu tenho que o gráfico da minha função
do primeiro grau dessa mesma questão
sandra quando eu não produzo peça aqui ó
0 crianças marcão montino r$40 franzi
uma questão você viu toda ou de função o
primeiro grau 'parabéns pra você'
parabéns pra mim e vamos juntos rumo ao
topo fred que eu faço tudo com o carinho
pra você
esses vídeos está é pro seu conhecimento
então eu vou levá um auto por calma
junto friends abraço sandro relembra a
função primeiro grau
tá aqui ó y é igual à x mais ver a mesma
coisa tá aqui foi então algemado
[Música]
vamos ver uma questão clássica não tem
função do primeiro grau sem uma questão
relacionando a missa ea ordenada o x e
um y logo nesse gráfico aqui o que nós
vamos fazer vamos montar a estrutura da
função de primeiro grau
logo temos que achar o coeficiente
angular que é o aaa e o coeficiente
linear que omer perfeito pra gente boa
honesta eu vou fazer de dois modos
primeiro foi explicado moto do que eu
acho mais prático você achar o
coeficiente angular e depois achar o
coeficiente linear sandro quando eu vou
poder fazer isso
já dei a dica o coeficiente ã gua eu
faço através do delta y sobre delta xixi
e para relacionar o delta y delta x eu
preciso de apenas dois pontos do gráfico
da reta né então eu tenho esse ponto
aqui que a qual está aqui ó 6 76 na
cabeça
canta na ordenada no y esse ponto aqui é
quem 1090 10 no x 90 no y logo tendo
estes dois ponte eu posso muito bem
achar meu coeficiente angular como
sandro assim coeficiente angular
variação de 2 y para variação de 2 x
sandro tanto faz eu pegar esse y daqui
- esse ou esse - esse tanto faz para
achar o delta y
porém você deve ter atenção que se você
pegar esse y - esse é o xis você vai
obedecer a mesma ordem na hora de achar
o delta x esse xis - esse daqui de baixo
então fui friends delta y vou fazer 90
menos 70 tac o delta y dia 2 pontes 90
menos 70 sobre o delta x que é quem 10
-6 tá aqui ó 10 -6 sandra eu vou achar o
coeficiente de angola' já show tá aqui ó
90 - 7020 sobre 10 -6 4 20 / 4 tac
meu coeficiente angular igual a 5 franz
perfeito você já achou o azulzinho
sandro reescreve pra mim a estrutura tac
sua estrutura nem a que além da função
na lei de formação da função que é o y
iguais x + b já ficou quem y é igual à
que é 55 vezes x mais
o bê que eu ainda desconheço que por
sinal o bê esse mesmo valor zinho aqui
né eu falei o coeficiente leão onde a
reta corta o eixo y mas eu não vou falar
disso agora não vou achar o bê aqui olha
além de formação da função como fluence
esse ponto aqui pertence à reta e esse
ponto aqui também pertence à reta ele
jogado dentro
a função ele torna em função uma
igualdade verdadeira
logo ele pode ser substituído x por dez
o ipam por 90 que a igualdade é
verdadeira sendo ela verdadeira quem vai
pular pra você
a única incógnita que faltou que omer o
substituísse das 90 mais bonitinho então
onde al x eu vou colocar 10
aqui há cinco vezes 10 onde é o y não
vou substituir o 90 igual 90 igual a 5
vence 10 mais mês andro mentindo eu te
digo que é verdade frente porque já
achamos omer aqui o 90 é igual a 50 + b
90 menos 50 40 é igual a 6 ou se você
quisesse 40 iguabinha obviamente b igual
a 40 friends achou coeficiente linear
vim aqui substitui e acha a informação
da função impressão é igual há aqui é o
5x mais b que a 40 perfeito então tá
aqui montamos a função
sandro não é nem concurso vestibular
como é pedido ele te dá que aqui é o
número de peças perfeito e chukchis the
dark wings eixo y é o valor é pra
produzir essas peças e ele pede a
relação um exemplo se eu fosse produzir
seis peças eu gastaria r$70 casa produza
dez peças gastarei 90 reais
ele já te da relação e fala que cresce
linearmente que configura uma função
primeiro grau
aí ele te pede um exemplo quanto
gastarei se for produzir nove peças
quanto eu vou gastar franz achando além
de formação da função x sendo o número
de peças que inventei isso agora mas
você está entendendo e y sendo o valor
pragas gasto para produzir essas peças
eu só substituiria aqui frentes light
light sandro dá um exemplo aqui o nove
peças quem a 9
é o xis para o x é igual a 9 qual é o
valor
qual é o y você votaria aqui ó y é igual
a cinco vezes a quantidade de peças
cinco vezes 9 mais 40 por sinal é o
valor fixo da produção e y é igual a 95
45 mais 40 o valor da produção de 9 peça
está aqui seria a imagem é o y 90 opa 85
reais
você vê aqui o subiria junto um tumba
teu aqui tomtom 85 reais
e aí foi frente você faz qualquer
questão de função do primeiro grau agora
montando além de formação da função
acham que o coeficiente angular
nesse mês o do ego a delta y sobre bento
x e achando coeficente linear
logo após assistir a ele apenas
substituindo um ponto da reta
dentro da estrutura que falta um bebê
achou b sucessos e tem além de formação
da função sandro mais me diz qual o
custo fixo deles e não produzir nenhuma
peça te desse piso sempre o valor de
bebê é o valor do peso independente e
onde a reta corta o eixo y logo ser
produzir 60 peças
o valor gasto apenas com luz ou com algo
fixo é quarenta reais frente estão junto
vem comigo que aqui é rumo ao topo valeu
[Música]
Browse More Related Video
5.0 / 5 (0 votes)