How to trade Turtle Soups (Liquidity Sweeps)

Arjo
14 Aug 202422:09

Summary

TLDRThis video script delves into the concept of 'liquidity sweep' or 'turtle soup' in trading, a strategy often misunderstood by traders. It explains the origins from the 'Turtle Traders' and their trend-following methods, highlighting the difference between a 'liquidity sweep' and a 'liquidity run'. The script teaches how to identify and trade these patterns, emphasizing the importance of understanding market liquidity, swing points, and the impact of large entities on price movements. It also introduces the idea of 'previous candle high and low' in the context of order flow and candle science, urging viewers to study these patterns through case studies for a deeper understanding.

Takeaways

  • πŸ“ˆ The concept of 'liquidity sweep' or 'turtle soup' is a trading strategy used to capitalize on market movements, particularly by trend traders known as 'Turtle Traders'.
  • πŸ“š The origin of 'turtle soup' is explained in 'The Complete Turtle Trader' book, which is recommended for further reading on the subject.
  • πŸ¦† Turtle Traders focus on trends and use breakout trading strategies, placing buy stops above recent highs and stop losses below recent lows.
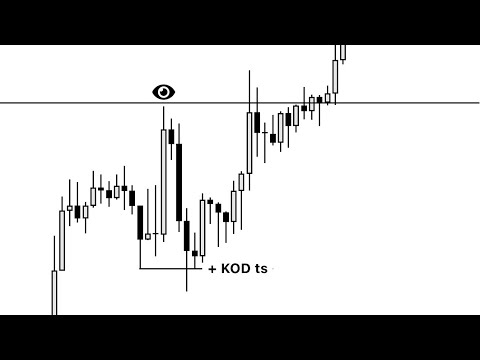
  • πŸ”„ A liquidity sweep occurs when the market trades above a high but then immediately reverses direction, causing a drawdown for breakout traders who placed their stop losses below the recent low.
  • 🏁 The difference between a 'liquidity sweep' and a 'liquidity run' is based on whether the market continues in the same direction after trading above a swing high or low.
  • πŸ’§ 'Liquidity' in trading refers to swing points, which are areas of the market where there is significant buying or selling interest.
  • πŸ”„ Understanding the market's comfort above a high or below a low is crucial for identifying potential liquidity sweeps and runs.
  • πŸš€ Large entities in the market require sufficient opposing liquidity to execute their large orders, which can lead to liquidity sweeps when they take profits or stop losses are triggered.
  • πŸ“Š The script emphasizes the importance of analyzing higher time frames for identifying significant trends and potential liquidity events.
  • πŸ•ŠοΈ 'Candle science sweeps' are similar to order flow sweeps but observed on different time frames, highlighting the fractal nature of market movements.
  • πŸ“ The script encourages traders to conduct case studies on order flow sweeps in trends and candle science sweeps to better understand and identify these patterns.

Q & A

  • What is the concept of 'liquidity sweep' or 'turtle soup' in trading?

    -The 'liquidity sweep' or 'turtle soup' refers to a trading scenario where a market breaks a trend line, often a high, but instead of continuing in the direction of the breakout, it reverses immediately, causing a stop-loss trigger for trend-following traders, leading to a rapid move in the opposite direction.

  • What is the origin of the term 'turtle soup'?

    -The term 'turtle soup' originates from 'Turtle Traders,' who are known for trend-following strategies. When these traders are taken out of the market due to a false breakout, it is metaphorically referred to as making 'turtle soup.'

  • Why are Turtle Traders susceptible to 'turtle soup' scenarios?

    -Turtle Traders are susceptible to 'turtle soup' because they use breakout trading strategies, placing buy stops above recent highs and stop-losses below recent lows. When the market breaks above a high but then reverses, it can quickly trigger their stop-losses, causing a short-term price drop.

  • What is the difference between a 'liquidity sweep' and a 'liquidity run'?

    -A 'liquidity sweep' occurs when the market trades above a swing high or below a swing low and then immediately reverses direction. A 'liquidity run', on the other hand, is when the market continues in the same direction after trading above a swing high or below a swing low, indicating a strong trend continuation.

  • How do large entities in the market use 'liquidity sweeps' to their advantage?

    -Large entities use 'liquidity sweeps' by placing large orders that require significant opposing liquidity. When breakout traders enter the market with buy stops, these large entities can sell to them, anticipating a sweep that will trigger the traders' stop-losses, allowing the large entities to take profits.

  • What is the significance of 'swing points' in the context of 'liquidity sweeps'?

    -Swing points, which include swing highs and swing lows, are significant in 'liquidity sweeps' because they represent potential reversal points in the market. Traders often place their stop-losses near these points, making them key levels for potential sweeps.

  • How can understanding 'liquidity sweeps' improve a trader's strategy?

    -Understanding 'liquidity sweeps' can help a trader anticipate potential market reversals following a breakout. This knowledge can be used to adjust entry and exit strategies, manage risk more effectively, and potentially capitalize on the rapid price movements that occur during a sweep.

  • What is the role of 'previous candle high' and 'previous candle low' in candle science?

    -In candle science, the 'previous candle high' and 'previous candle low' are used to identify potential areas of price rejection or continuation. These levels can indicate where the market may find support or resistance, which can be crucial for understanding the direction of future price movements.

  • How can a trader identify an 'order flow sweep'?

    -An 'order flow sweep' can be identified when the market creates a fair value gap or area but fails to continue in the expected direction, leaving behind a swing low or high. Traders can then look for a subsequent move that 'sweeps' through this level, indicating a potential reversal.

  • What is the importance of 'fair value gaps' and 'fair value areas' in trading?

    -Fair value gaps and areas are important in trading as they represent significant price levels where the market may find support or resistance. Once these levels are traded into, they can be used as reference points for future price action, including potential sweeps or runs.

  • How can a trader differentiate between a 'liquidity sweep' and a 'liquidity run' using technical analysis?

    -A trader can differentiate between a 'liquidity sweep' and a 'liquidity run' by observing the market's behavior after trading through a swing high or low. A 'sweep' will show immediate price reversal, while a 'run' will show continued movement in the direction of the trend.

Outlines

00:00

πŸ“ˆ Understanding Liquidity Sweeps and Turtle Soup

The script introduces the concept of liquidity sweeps, also known as turtle soup, which are trading strategies based on the behavior of trend traders, specifically the Turtle Traders. It explains the origin of the term, which comes from the trend traders' tendency to get taken out of the market, and how they operate by focusing on trends and breakout trading. The explanation includes the use of buy stop orders above highs and placing stop-loss orders below recent lows. The paragraph also describes how a liquidity sweep differs from a liquidity run and the importance of swing points in identifying liquidity.

05:00

πŸ’Ό Market Liquidity and the Role of Large Entities

This paragraph delves into the necessity of market liquidity for large entities to execute their significant orders. It discusses the concept of a market needing both buyers and sellers, and how large entities require sufficient opposing liquidity to execute their trades. The script uses the example of breakout traders and hedge funds, who assume the market will continue in a certain direction after breaking a swing high or low. It explains how these entities use stop-loss orders as sell orders and how large entities can take profit from these, creating a liquidity sweep. The paragraph emphasizes the speed of these sweeps and the importance of understanding the difference between a sweep and a run in the context of market liquidity.

10:00

πŸ•΅οΈβ€β™‚οΈ Analyzing Liquidity Sweeps and Runs Through Technical Analysis

The script continues with a deeper analysis of liquidity sweeps and runs, focusing on the technical analysis perspective. It explains the importance of being comfortable above a high or below a low and the implications for large entities in the market. The paragraph discusses how large entities can use the stop-loss orders of breakout traders to their advantage, targeting the most recent swing highs or lows for their take-profit orders. It also touches on the concept of fair value gaps and how they can be used to identify potential sweeps or runs in the market, emphasizing the importance of removing fair value gaps from charts once they have been traded into for better trading accuracy.

15:03

πŸ” The Interplay of Order Flow and Candle Science in Liquidity Sweeps

This paragraph explores the relationship between order flow and candle science in the context of liquidity sweeps. It explains how a fair value gap or area can lead to a sweep if the market fails to create a new gap or area after a rejection. The script discusses the concept of respect candles and how they can indicate potential sweeps based on wicks below a swing low or high. It also introduces the idea of previous candle high and low (PCH and PCL) and their role in sweeps, illustrating how these can be used to continue a trend in a different time frame. The paragraph concludes by emphasizing the importance of understanding these concepts for effective trading.

20:04

πŸ“š Practical Application of Liquidity Sweeps in Trading

The final paragraph provides actionable advice for traders looking to apply the concepts of liquidity sweeps in their trading strategies. It suggests conducting case studies on order flow sweeps in trends and candle science sweeps to identify patterns and improve understanding. The script encourages traders to mark these patterns on their charts and to use the provided link in the description to access a free study tool. The paragraph concludes by highlighting the importance of this knowledge in building a robust trading strategy.

Mindmap

Keywords

πŸ’‘Liquidity Sweep

Liquidity Sweep, also known as Turtle Soup, is a trading concept that refers to a situation where a market breaks out of a trend but then reverses direction quickly, causing stop-loss orders to be triggered and potentially leading to a rapid price movement in the opposite direction. In the video, it is explained as a strategy that large entities might use to capitalize on breakout traders' stop-loss orders, creating a quick and aggressive move against the trend.

πŸ’‘Turtle Traders

Turtle Traders are a group of trend traders known for their disciplined approach to trading based on trend following strategies. The term originates from the book 'The Complete Turtle Trader' and is used in the video to describe traders who focus on trends and use breakout trading strategies, which can sometimes lead to them being caught in a liquidity sweep or 'turtle soup' scenario.

πŸ’‘Breakout Trading

Breakout trading is a strategy where a trader enters a trade in anticipation of a continued move in the direction of a recent price breakout. In the video, it is mentioned that Turtle Traders use this strategy, placing buy stop orders above recent highs, expecting the price to continue rising and respecting the trend.

πŸ’‘Stop-Loss

A stop-loss order is a tool used by traders to limit their loss on a trade. It is set at a certain price level, and when the market reaches that level, the order becomes a market order to sell or buy, closing the position. In the context of the video, the stop-loss is placed below recent lows for long positions, and its triggering can be part of the liquidity sweep dynamic.

πŸ’‘Trend

A trend in trading refers to the general direction in which prices are moving. It can be upward (bullish) or downward (bearish). The video discusses how Turtle Traders focus on identifying and trading with the trend, using breakouts to enter positions expecting the trend to continue.

πŸ’‘Swing High/Low

Swing highs and lows are points on a price chart that represent temporary resistance or support levels, respectively. In the video, swing points are discussed as areas of liquidity, which are significant for both breakout and sweep strategies, as they can act as levels where large entities might place orders to trigger stop-losses or continue the trend.

πŸ’‘Fair Value Gap

A fair value gap is a concept that refers to a price area that the market is expected to reach based on the balance of supply and demand. In the video, it is mentioned that when the market trades back into a fair value gap or area, it can leave behind swing lows or highs that can be used for subsequent sweeps or runs.

πŸ’‘Order Flow

Order flow in trading refers to the movement of prices as a result of the aggregate of all orders being executed in the market. The video discusses how understanding order flow can help identify potential liquidity sweeps and runs, as large entities may use the order flow to their advantage in executing their strategies.

πŸ’‘Candle Science

Candle science is a term used in the video to describe the analysis of price action as depicted on candlestick charts, focusing on the formation of candles and the information they provide about market sentiment and potential future price movements. It is related to order flow and is used to identify potential sweeps or runs on different time frames.

πŸ’‘Previous Candle High/Low

The previous candle high and low refer to the highest and lowest prices of the previous completed candlestick on a chart. In the video, these levels are discussed as potential areas for sweeps in candle science, where the market might trade below the previous candle low or above the previous candle high to continue in the direction of the trend.

πŸ’‘Run on Liquidity

A run on liquidity is a term used in the video to describe a situation where the market continues in the direction of a trend after breaking a swing high or low, as opposed to a liquidity sweep where the market reverses quickly after the breakout. It is a scenario where large entities may continue to add to their positions, pushing the market further in the trend direction.

Highlights

The concept of 'liquidity sweep' or 'turtle soup' in trading is introduced, which is a strategy used when trend traders get taken out of the market.

Turtle Traders, known for trend trading, use breakout trading strategies, placing buy stops above highs and stop losses below recent lows.

A liquidity sweep occurs when the market trades above a high but immediately continues lower, causing a drawdown for breakout traders.

The difference between a 'liquidity sweep' and a 'liquidity run' is explained, with the former involving a trade above a high followed by a drop, and the latter continuing in the same direction.

Liquidity is defined as swing points, which are significant in the strategies of Turtle Traders and other trend traders.

An analogy is provided to explain the importance of liquidity for larger entities in the market, emphasizing the need for opposing orders for trade execution.

The video discusses how large entities can exploit breakout traders' strategies by selling to their buy stops and targeting their stop losses.

The concept of 'comfortable above a high or below a low' is introduced to understand market movements and the intentions of large entities.

The importance of time frames in identifying liquidity sweeps and runs, with higher time frames being more relevant for large entities.

The video explains how to identify aggressive moves by large entities through fair value gaps and expansion phase candles.

The role of previous candle high (PCH) and previous candle low (PCL) in identifying potential sweeps and runs in candle science.

The narrative of market defense lines is discussed, explaining how the last line of defense is the swing point without a fair value gap.

The difference between order flow sweeps and candle science sweeps is highlighted, showing how they are similar but seen through different time frames.

An order flow sweep is demonstrated, where a fair value gap or area is created but not followed by a new gap, leading to a sweep to a swing low.

Candle science sweeps are explained, where a previous candle low is used to continue a move higher, seen as a respect candle on the same time frame.

The video concludes with a call to action for viewers to study order flow sweeps in trends and candle science sweeps through case studies.

Transcripts

play00:00

one of the most fancy Concepts in

play00:02

trading is the liquidity sweep or the

play00:04

turtle soup but you need to know how to

play00:06

use it and where to look for it and that

play00:09

is exactly what you are going to be

play00:11

learning in this video so with video

play00:14

number eight in the MMC series we are

play00:16

going to go over liquidity sweep in

play00:18

other words turtle soup now it surprises

play00:20

me how many Traders are looking to trade

play00:23

Turtle soups but they actually have no

play00:25

clue what the origin story of a turtle

play00:28

soup is the concept turtle soup is based

play00:31

around Turtle Traders the cover that you

play00:33

see on the right side is a book The

play00:36

Complete Turtle Trader it's a good book

play00:38

if you do want to give it a read and

play00:40

turtle Traders are known as Trend

play00:42

Traders and those Trend Traders

play00:45

sometimes get taken out of the market

play00:47

that is known as a turtle soup so these

play00:50

Turtle Traders they focus on a trend now

play00:53

a trend very simple looks something like

play00:56

this and it continues higher respecting

play00:58

the lows not coming below the lows right

play01:01

there that is the perfect trending

play01:04

conditions now Turtle Traders like we

play01:06

mentioned are Trend Traders and they use

play01:09

a form of breakout trading now what that

play01:12

means is the following if we have

play01:14

trending conditions and we trade above

play01:17

high and we keep respecting lows since

play01:20

we are trading above highs and we're

play01:23

breaking through those highs right there

play01:26

they use a strategy that capitalizes on

play01:28

assuming that we want to continue higher

play01:31

after taking out previous highs right

play01:33

there and that the trend will continue

play01:35

respecting lows and breaking above those

play01:39

highs now when they place an order in

play01:41

the market and they use that breakout

play01:43

strategy they place a buy stop above the

play01:46

high sitting right there assuming that

play01:48

it wants to continue higher a buy stop

play01:51

is when we trade above a certain level

play01:54

your order gets filled when the buy stop

play01:56

is located there where do they Place

play01:58

their stop- loss they Place their stop

play02:00

loss below the recent lows below the

play02:03

recent swing lows now a lot of the time

play02:06

this again Works quite well but there

play02:08

will be times where we have a trend and

play02:11

we continue higher and we trade above

play02:14

the high but instead of continuing

play02:16

higher we sweep the high towards the

play02:18

left we sweep the most recent low and

play02:21

then we continue higher so you can

play02:23

imagine when there's a breakout Trader

play02:26

above that high who assumes is going

play02:27

higher with a stop loss below the recent

play02:30

low right there gets filled in their

play02:32

order right there immediately is in draw

play02:35

down their stop- loss gets hit right

play02:37

there and then we continue higher this

play02:39

is the origin of a turtle soup and this

play02:41

is the understanding that we are going

play02:43

to build onto now this turtle soup is

play02:46

also known as a liquidity sweep so a

play02:48

liquidity sweep exact same thing as a

play02:50

turtle soup as well now next to a

play02:52

liquidity sweep we also have something

play02:55

known as a liquidity run or often

play02:57

referred to as a run on liquidity so

play03:00

what is then the difference between that

play03:01

sweep and that run of liquidity well it

play03:04

all starts with the liquidity part and

play03:06

you need to understand when we refer to

play03:08

liquidity liquidity is Swing points so a

play03:12

swing high is liquidity a swing low is

play03:14

liquidity again that all refers back to

play03:17

understanding those Turtle Traders when

play03:19

they are looking to use their strategy

play03:21

of breakout trading they refer to swing

play03:24

highs when the market is strong so

play03:26

breaking above a swing High the market

play03:28

is strong and where do most Traders

play03:30

Place their stop- loss below swing lows

play03:33

and also above swing highs so liquidity

play03:36

is Swing points if we take a look at

play03:37

this example then here we see that swing

play03:40

point right there which is the swing

play03:43

High when we talk about a liquidity

play03:45

sweep then we assume that we trade above

play03:48

the high like we're seeing right there

play03:50

we sweep the liquidity by then

play03:53

immediately continuing lower whilst if

play03:56

we are talking about a run on liquidity

play03:59

then we are talking about the following

play04:01

where if we again have that swing High

play04:03

instead of trading above it then

play04:06

continuing lower immediately we continue

play04:09

in the same direction so we continue

play04:11

higher so a run of a swing high is that

play04:15

we can continue higher The Sweep of a

play04:17

swing high is that we trade above the

play04:19

swing high and immediately continue

play04:21

lower so in context of those Turtle

play04:24

Traders the method that they use by

play04:26

breakout trading so using the buy stop

play04:29

to to capitalize on the Move higher they

play04:31

are expecting a run on liquidity so that

play04:34

when we take out that swing High we keep

play04:37

on continuing higher whereas if we have

play04:39

that sweep of liquidity we do not

play04:42

continue higher and we immediately after

play04:44

trading above the high continue lower

play04:46

now I like to also use the analogy of

play04:48

being comfortable above a high or a low

play04:51

and what do I mean by that now the whole

play04:53

premise behind this liquidity is that

play04:55

there's a bigger entity involved so the

play04:58

way the market operates is that when

play05:00

someone is buying there needs to be on

play05:02

the other side someone that is selling

play05:05

so if you are trying to buy a car I need

play05:07

to sell you that car if you are trying

play05:09

to sell your car I could buy that car

play05:11

from you for every seller there needs to

play05:13

be a buyer for every buyer there needs

play05:15

to be a seller now for Traders like you

play05:17

and me who are not trading significant

play05:19

loss sizes it's not that relevant as in

play05:23

of course on the other side there still

play05:24

needs to be a buyer or a seller but we

play05:26

can get filled our order can get filled

play05:29

quite easily in the market where if

play05:31

we're talking about bigger entities in

play05:33

the market that have such huge orders

play05:36

that they can't simply click buy or sell

play05:38

at any moment in time they need enough

play05:41

opposing liquidity so where they are

play05:43

trying to buy with a lot of orders they

play05:46

need on the opposing end a lot of

play05:49

Sellers as well this is exactly where

play05:52

the second example comes in because

play05:55

think about it those Turtle Traders and

play05:57

not only those Turtle Traders a lot of

play05:59

Traders are Trend Traders big hedge

play06:02

funds for example are also known as

play06:05

trending Traders when we break above

play06:08

this swing High towards the left they

play06:10

assume it's going to run that liquidity

play06:12

and continue higher so they have a buy

play06:15

stop right there that's what breakout

play06:17

Traders do and when those buy stops get

play06:20

filled they of course need to get filled

play06:22

by someone else selling so if that large

play06:26

entity wants to sell right there they

play06:28

have enough buyers to sell to then

play06:31

there's two things going on right there

play06:33

those breakout Traders are in a buy

play06:36

right now when those breakout Traders

play06:38

are in a buy they Place their stop- loss

play06:40

below recent swing lows so their stop

play06:43

loss is what it is a sell order and

play06:45

those large entities that just sold

play06:49

right there to the breakout Traders

play06:51

their buys their take profit can be

play06:54

below this swing low right there because

play06:57

that is where those breakout Traders

play06:59

they're stop stop loss is and since that

play07:01

stop- loss is a sell order and this take

play07:03

profit of those large entities is a buy

play07:06

order a fair exchange can happen again

play07:09

where they have enough opposing

play07:11

liquidity to buy to quote unquote

play07:14

willing sellers so for example on

play07:17

Australian dollar US Dollar on the

play07:19

weekly time frame and the reason why we

play07:21

then look at the weekly time frame is

play07:23

because the higher time frames are more

play07:25

relevant that's what large entities work

play07:28

off of when we break below this low

play07:30

right here and we assume breakout

play07:32

Traders are using sell stops to get

play07:34

involved right there Place their stop

play07:37

loss above the most recent swing high

play07:39

right there that's an opportunity again

play07:42

for large entities to place their buys

play07:45

as well below this low right here to

play07:48

then Target the most recent swing High

play07:51

because then again there's willing

play07:53

buyers to our cells and when I then

play07:55

mention that we can't get comfortable

play07:57

below a low like this is because the

play08:00

following liquidity sweeps happen

play08:02

extremely fast we come below the low and

play08:05

we immediately Target the opposing side

play08:08

in the form of those swing highs right

play08:10

there that is because if that large

play08:13

entity wants their take profit to be hit

play08:15

and that take profit when they're

play08:17

looking at buys is a sell order above a

play08:20

swing high and Above That Swing High we

play08:22

also had the stop loss of a breakout

play08:24

Trader that was looking to sell

play08:26

initially that stop- loss is a buy order

play08:30

because you're buying back at a loss so

play08:32

we have willing buyers for the sellers

play08:35

to take profit and this is only possible

play08:37

because we are not comfortable below

play08:39

this low and we have an immediate

play08:41

aggressive move higher because the

play08:43

breakout traders that we're expecting

play08:45

price to continue lower are immediately

play08:48

almost immediately in draw down since

play08:50

they are in draw down almost immediately

play08:53

they have a very difficult time to

play08:55

mitigate their position meaning they

play08:57

can't get out of that position very e

play08:59

easily since they have a difficult time

play09:01

to get out of that position and they

play09:03

can't go break even for example because

play09:05

they are already in draw down then

play09:07

eventually their stop loss can be used

play09:10

as the large entities take profit and

play09:13

that is liquidity sweep whereas if we

play09:16

compare it with this high right here

play09:18

where there are also breakout Traders

play09:20

sitting right there with their stop-

play09:22

loss below recent swing lows right there

play09:25

Then here we can see we don't have an

play09:27

immediate aggressive push lower that

play09:30

tells us there's no intention to reach

play09:34

this swing low right there by large

play09:36

entities because they don't need it at

play09:38

that time now how do we know it's an

play09:40

aggressive move by again understanding

play09:43

fair value gaps expansion phase candles

play09:45

so when we are comfortable above a high

play09:47

we can assume that it's a run and we can

play09:50

at least continue higher towards the

play09:51

next targets right there that is the

play09:54

difference between a liquidity sweep and

play09:56

a liquidity run not only seen from the

play09:59

perspective Ive of the technical

play10:00

analysis the chart but also the logic

play10:02

behind that being comfortable above a

play10:04

high or being comfortable below a low

play10:06

now that's not an easy concept to

play10:08

understand the first time around but

play10:09

it's not supposed to be easy when you do

play10:12

understand it it's going to be

play10:14

absolutely worth it now moving on when

play10:17

we talk about liquidity we also talk

play10:20

about previous candle high and previous

play10:22

candle low bch and PCL why is that well

play10:26

remember when we talked about kandle

play10:27

signs and how order flow leads to Candle

play10:30

signs so multiple candles lead to one

play10:33

candle well what is a swing high on a

play10:37

different time frame on left side we

play10:39

have this swing high sitting right there

play10:41

this on one time frame can again be a

play10:44

swing high but if you go up in time

play10:46

frames that swing High turns into a

play10:50

previous candle high and when we have

play10:52

this previous candle High we could also

play10:55

sweep the previous candle high right

play10:57

there to then see you lower this is then

play11:01

through the lens of candle science a

play11:03

candle science sweep and on the left

play11:06

side we have an orderflow sweep we're

play11:09

going to be discussing where we would

play11:11

like to see order flow sweeps and where

play11:14

we would like to see candle science

play11:16

sweeps now before we dive into that

play11:18

let's again understand where we are

play11:20

coming from because this is still

play11:23

talking about the narrative so if we are

play11:25

going higher or if we are going lower

play11:27

then where are we going lower from we

play11:30

had that flaw that first line of defense

play11:32

we had that overlapping defense and now

play11:35

we have arrived at the last line of

play11:37

defense which is the swing point which

play11:39

is the last area that we can still

play11:41

continue lower or continue higher from

play11:44

but we need to understand that the last

play11:47

line of defense is focused on a lack

play11:50

without a fair value Gap like we've

play11:52

already discussed as well in the

play11:54

narrative video so the last line of

play11:55

defense is a swing point the last area

play11:58

we can still continue low for or higher

play11:59

from then ranking a last L of Defense

play12:02

from best to worst we want to have no

play12:05

fair value Gap in the leg so essentially

play12:08

not an orderflow lack because if we do

play12:11

have an FG in the lack and it is an

play12:14

orderflow lack then most likely we can

play12:16

either respect the fair value Gap or the

play12:19

fair value area to then continue lower

play12:22

so the fla or the A and if we do

play12:24

continue higher and do not respect the

play12:26

fla or the a then the lot becomes the

play12:29

Target and not necessarily something we

play12:32

want to trade from because a last Aline

play12:34

of Defense in an orderflow lack so with

play12:37

a fair value Gap in the lag is not very

play12:39

likely to have a sweep it is more likely

play12:42

to see a run of that liquidity so the

play12:44

focus is going to be on the above

play12:46

example where the last line of defense

play12:49

is essentially also the first line of

play12:51

defense it is the only defense that we

play12:53

have in the lag right there since

play12:55

there's no fair value Gap there's no

play12:57

fair value area there's no orderflow

play12:59

lack so we only have that swing point

play13:02

that we can continue lower from so those

play13:05

last line of defenses not being in an

play13:08

order for lack not having a fair value

play13:10

Gap that's the ones that we're going to

play13:11

focus on when we do have a fair value

play13:14

Gap in the lack and it's just a normal

play13:16

order for lack that last am of defense

play13:18

is again not something we want to trade

play13:20

from it is something we want to trade

play13:22

towards potentially that is something

play13:24

that we're going to go over not in the

play13:26

next video but the video after that now

play13:28

before we dive into that let's quickly

play13:30

remind ourselves of the previous candle

play13:32

high and previous candle low again those

play13:34

candle science sweeps when we're talking

play13:36

about previous candle highs previous

play13:37

candle lows and those order flow sweeps

play13:40

when we are simply talking about swing

play13:42

points now the first one we are going to

play13:44

go over is the orderflow sweep and an

play13:46

orderflow sweep ideally looks something

play13:49

like this we create a fair value Gap

play13:52

this can also be a fair value area so

play13:54

this can either be an OD or a lot where

play13:57

the important part is where we are

play13:59

already expecting higher prices from

play14:02

then when we are expecting higher prices

play14:04

and something like this happens we

play14:06

create a rejection going higher but we

play14:09

fail to create a new fair value Gap

play14:12

going higher so the strength the

play14:14

intention is not fully there well what

play14:17

happens we leave behind a swing low

play14:20

without a fair value Gap the low is what

play14:23

we can now sweep to continue higher and

play14:25

then we're talking about this swing low

play14:28

right there that is a swing low but we

play14:31

can now sweep to then afterwards still

play14:34

continue higher this is a scenario that

play14:36

will sometimes happen where we struggle

play14:39

to continue higher of the initial fair

play14:42

value area or fair value Gap then we

play14:44

create a swing low right there and then

play14:46

continue higher off of that instead now

play14:49

this sweep below that swing low is then

play14:52

seen through two lenses because when we

play14:55

come below that swing low right there on

play14:57

the same time frame as the swing low it

play15:00

is seen as a respect candle So based on

play15:02

candle signs like we've gone over that

play15:05

respect Candle on the lower time frame

play15:07

is of course order flow lacks going

play15:10

lower and then higher on the indices

play15:12

right here on the E mini S&P we see that

play15:15

we have a previous order flow lack going

play15:18

higher right here we trade back into the

play15:21

fair value Gap and we actually also

play15:23

trade back into the fair value area

play15:25

sitting right there now when we trade

play15:27

back into that we have a re retion so

play15:29

the rejection happens right here this

play15:32

rejection fails to follow through now

play15:35

fails to follow through means that we do

play15:38

not create a new fair value Gap

play15:40

afterwards when this is the case and we

play15:42

then create a swing low right here the

play15:45

previous fair value area previous fair

play15:48

value Gap that we had those are already

play15:50

mitigated so again they can only be

play15:52

traded into one time but what they do

play15:55

leave behind at that fair value area and

play15:58

fair value Gap is a swing low right

play16:00

there and that swing low right here is

play16:02

what we can then sweep to then continue

play16:05

higher this on the same time frame as

play16:08

this swing low right here is again seen

play16:10

through candle signs so the respect

play16:12

candles the Wicks wicking below that

play16:15

swing low if you go down time frames

play16:17

then this sweep is again seen through

play16:19

order flow lacks so we first have order

play16:21

flow laxs going lower to then order flow

play16:24

lacks going higher which turns into that

play16:26

wick on The Daily time frame now I want

play16:29

to emphasize on the fact right here how

play16:31

those PD Rays work because a fair value

play16:34

Gap can be traded into one time a fair

play16:37

value area can be traded into one time

play16:41

so if we take a look at this fair value

play16:43

gap for example right here then this

play16:46

fair value Gap has already been traded

play16:48

into with this sting that Wick right

play16:51

there but whenever we sting into a fair

play16:54

value gap or into a fair value area we

play16:56

do leave behind something and that

play16:59

something is either swing low or swing

play17:02

high and this leaves behind a swing low

play17:04

right there that swing low is then used

play17:08

to continue higher off of instead so

play17:10

this fair value Gap can already be

play17:12

deleted from your chart as soon as we

play17:15

trade back into it it's not relevant

play17:17

anymore to trade from now when we look

play17:20

at us dollar JPY right here and we have

play17:23

our Direction set on lower prices

play17:25

towards that low right there we create

play17:27

this Fair V which we can continue lower

play17:30

from we see the same exact thing we

play17:32

struggle to continue lower initially we

play17:35

leave behind a swing high right there

play17:37

that swing high is what we can continue

play17:39

lower from not the fair value Gap

play17:42

because the fair value Gap is already

play17:44

mitigated if you leave that fair value

play17:46

on your chart it's not instant to trade

play17:49

from it becomes just a random box on

play17:52

your chart if you do not remove that

play17:54

fair value Gap you lose a lot of

play17:56

accuracy in your trading but we do leave

play17:58

behind a swing High That Swing high is

play18:00

what we can now sweep to then continue

play18:03

lower from which again seen through two

play18:05

lenses on the same time frame it's seen

play18:08

as that candle signs respect candle if

play18:10

we go down time frames it's again order

play18:12

flx going higher to then order flx going

play18:15

lower any fair value Gap that has

play18:17

already been traded into is not relevant

play18:19

anymore so for example here we are not

play18:22

rejecting off the fair value Gap no we

play18:24

are rejecting of the swing load that we

play18:27

left behind when we came into the fair

play18:29

value Gap the first time this is the

play18:31

same for fair value areas if you keep

play18:34

that fair value gap on your chart it

play18:35

just becomes a random boxed and you

play18:37

might as well just simply trade support

play18:39

and resistance all right now that is an

play18:42

orderflow sweep where it's actually a

play18:44

swing low or a swing high now we're

play18:47

going to go over that candle science

play18:49

sweep it's essentially the same thing

play18:51

because again remember kendle science is

play18:53

order flow on a different time frame and

play18:55

Order flow is kendle science on the

play18:57

higher time frame so this candle science

play18:59

sweep right here is the following we

play19:02

have an area that we can continue higher

play19:04

from so that can again be a fair value

play19:07

Gap can be a fair value area the first

play19:09

candle does not reject then we focus on

play19:13

a previous candle low sweep so on the

play19:15

example on the left you'll see we have

play19:17

this swing high right there that we can

play19:19

Target we run that swing high that turns

play19:22

into a fair value area right there again

play19:25

this applies to a fair value Gap fair

play19:27

value area the same same as an orderflow

play19:29

sweep can also be applied to a fair

play19:31

value area or a fair value Gap then when

play19:33

we retrace back into that discount array

play19:36

the first candle is not that respect

play19:39

candle based on candle signs so it's not

play19:41

a rejection going higher when this is

play19:44

the case we can see a previous candle

play19:47

low sweep the previous candle low

play19:49

sitting right there we can trade below

play19:51

it to then continue higher this is a

play19:54

candle science sweep where the previous

play19:56

candle low is used to then continue

play19:59

higher off of and that previous candle

play20:00

low on the lower time frame is again of

play20:04

course a swing low so it's an orderflow

play20:07

sweep on a different time frame now this

play20:09

sweep of that previous candle low and

play20:10

that Wick just below it is again seen

play20:13

through two lenses here we have a

play20:15

respect candle right there but on the

play20:17

lower time frame it's again orderflow La

play20:19

going lower and then higher so looking

play20:22

again at e mini S&P right here we have

play20:25

this fair value gap which we might want

play20:27

to continue low from we are running this

play20:30

low and not sweeping this low to the

play20:32

left which helps us understand the

play20:34

overall direction as well then when we

play20:37

sting into this fair value Gap right

play20:40

there we see the first candle does not

play20:42

reject so the second candle sweeps the

play20:45

previous candle high right there to then

play20:47

continue lower which again on this time

play20:49

frame is seen as that respect candle but

play20:52

if we go down time frames then that

play20:55

previous candle high is simply a swing

play20:58

High right here where we see orderflow

play21:00

Lex going higher to then orderflow Lex

play21:02

going lower now this is again something

play21:05

that will happen quite often for example

play21:07

in this fair value Gap right here first

play21:09

candle does not reject previous candle

play21:10

low sweep right there to then continue

play21:13

higher targeting these highs right there

play21:16

this is a candle science sweep and this

play21:18

is essentially the same thing as an

play21:20

orderflow sweep just seen through

play21:23

different time frames that's why

play21:24

everything that we're learning is

play21:26

fractal it's just about understanding

play21:28

how we combine those time frames and how

play21:30

we don't get confused by looking at

play21:32

different time frames this is liquidity

play21:35

sweep this is a turtle soup and this

play21:38

understanding is what we're going to

play21:40

build on in the next videos but before

play21:43

we do that do yourself favor and start

play21:46

doing case studies and the case study

play21:48

for this video is study orderflow sweeps

play21:51

in Trends and candle science sweeps so

play21:54

just mark them out on your chart and see

play21:56

where they happen see the patterns that

play21:58

you can notice you can easily do case

play22:00

studies through the link in the

play22:02

description where you can get access to

play22:04

a study notion completely for free as

play22:07

well all right perfect thank you

Rate This
β˜…
β˜…
β˜…
β˜…
β˜…

5.0 / 5 (0 votes)

Related Tags
Liquidity SweepTurtle TradersBreakout TradingTrend AnalysisOrder FlowCandle ScienceSwing PointsTechnical AnalysisTrading StrategiesFair Value Gap