This Secret Trading Plan Will Skyrocket Your Profits! | The Best ICT & SMC trading strategy #SMC#ICT

Smart Risk
21 Jul 202422:35

Summary

TLDRThis episode of 'Smart Risk' introduces the 'Whale Scoop' trading model, a strategy designed to enhance win rates by leveraging liquidity sweeps and stop hunts in key market areas. The video offers a step-by-step guide on identifying valid whale scoop patterns, executing trades with both aggressive and conservative entry models, and emphasizes the importance of backtesting for successful trading. Real trade examples illustrate the model's application, aiming to help traders become consistently profitable.

Takeaways

  • πŸš€ The 'whale scoop model' is an exclusive trading strategy that aims to revolutionize market approach and potentially increase win rates significantly.
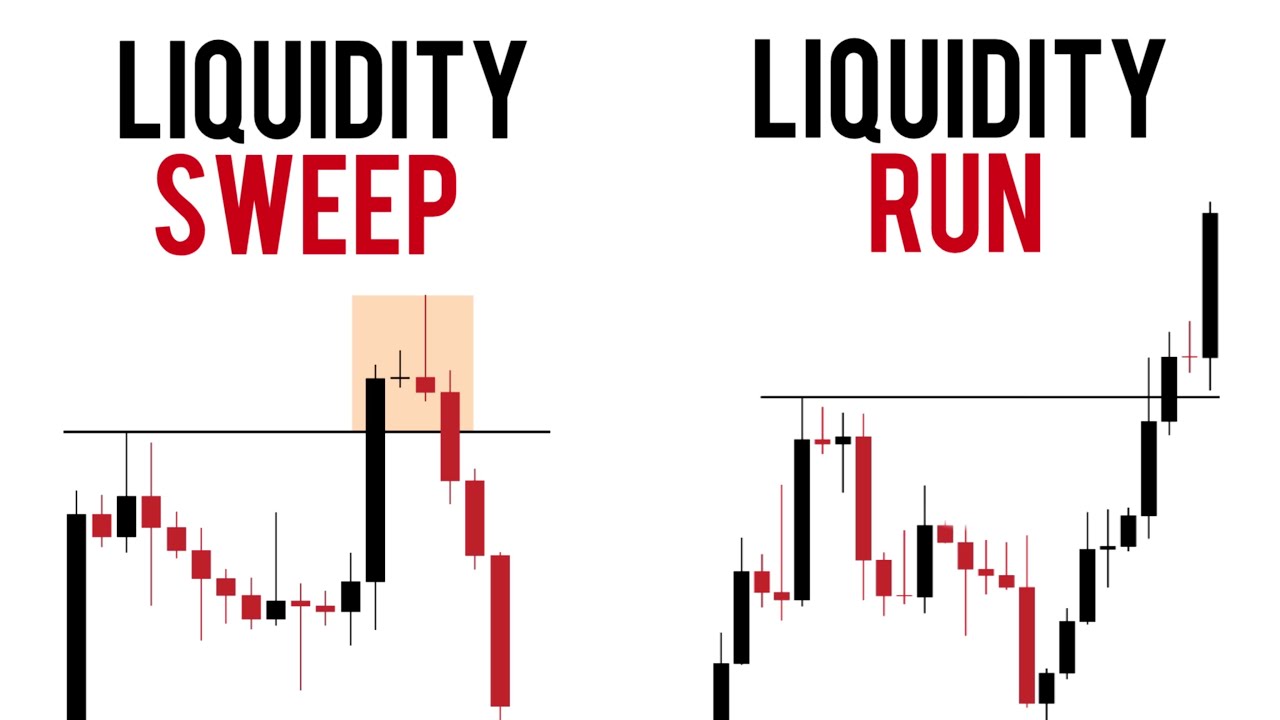
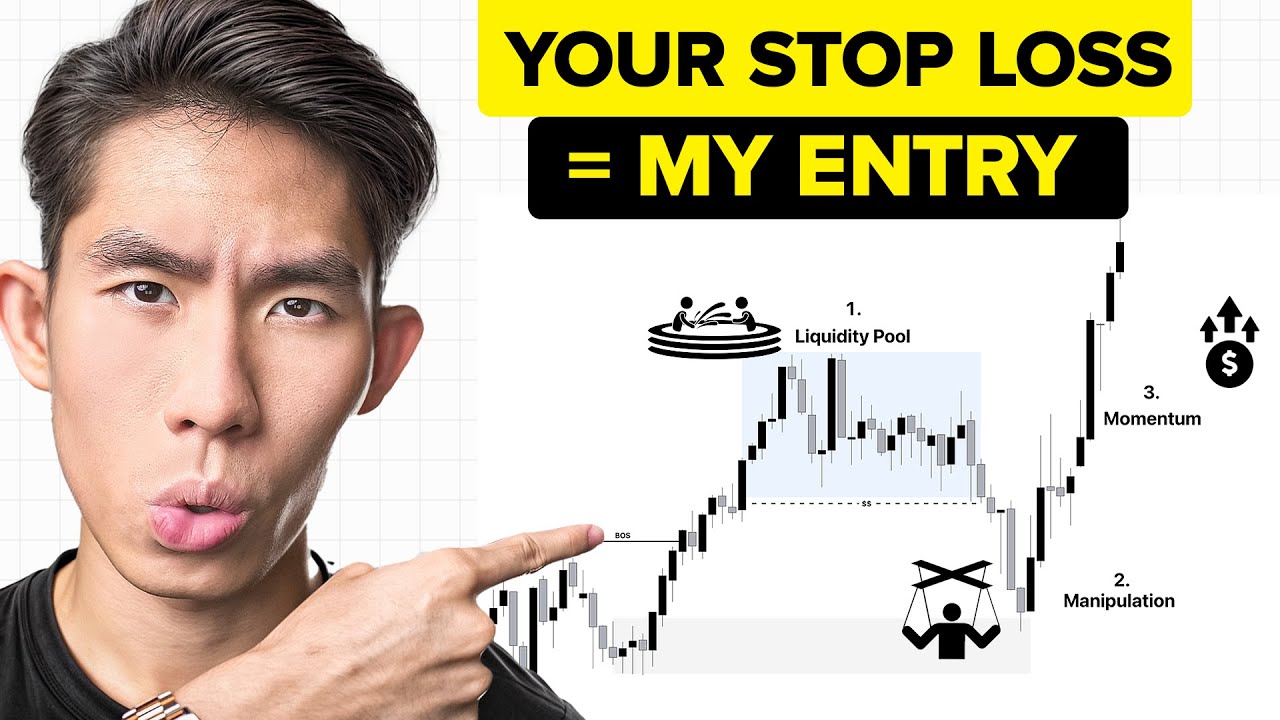
  • 🧠 The core mindset of the model involves recognizing liquidity sweeps and stop hunts in key static liquidity areas, such as major highs and lows, to capitalize on market sentiment shifts.
  • πŸ’‘ The model is based on the idea that after a key static liquidity pool is cleared out, the price often moves towards the opposing side's liquidity, aligning with the market's overall direction.
  • πŸ“ˆ Traders should consider the whale scoop as a high probability setup, especially when liquidity below a recent low has been swept, triggering stop losses and increasing buying pressure.
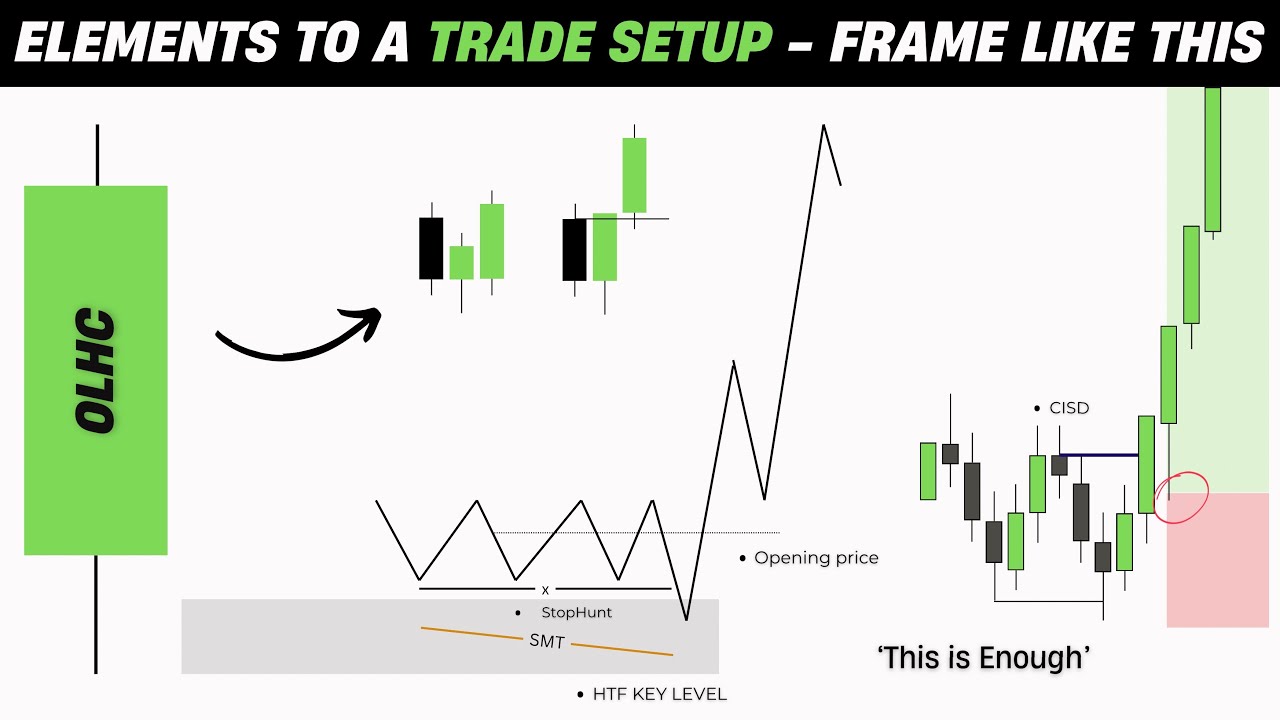
  • πŸ” Identifying valid whale scoop patterns on a price chart is crucial and involves looking for specific candlestick patterns that sweep out recent key areas and then immediately reverse direction.
  • πŸ•° The whale scoop often features a long wick, especially on higher time frames, and the subsequent candles should not exceed the initial candle's body or wick in determining pattern validity.
  • πŸ“‰ Two main entry models are discussed: the aggressive entry model, which uses a single time frame for analysis and execution, and the conservative entry model, which uses two time frames for analysis and confirmation before execution.
  • πŸ“ Backtesting is emphasized as a critical step in the trading journey, with the recommendation to test strategies at least 100 times before applying them to a real account.
  • πŸ“‰ Real trade examples are provided to illustrate the application of the whale scoop model, demonstrating how to identify patterns and execute trades with both aggressive and conservative entry models.
  • ⏳ The importance of timing is highlighted, noting that there are specific times on the chart when the whale scoop plan is more likely to be successful.
  • πŸ”— The video encourages viewers to subscribe, engage with the content, and provide feedback for future topics, emphasizing the value of community interaction in enhancing the trading experience.

Q & A

  • What is the main purpose of the 'whale scoop' trading model discussed in the video?

    -The 'whale scoop' trading model is designed to revolutionize the way traders approach the market, with the potential to significantly increase their win rates by identifying specific liquidity sweep patterns and capitalizing on market sentiment shifts.

  • What are the key liquidity areas that the whale scoop model focuses on?

    -The model focuses on key static liquidity areas such as major highs and lows, key supply and demand zones, and other external range liquidity areas in the market.

  • How does the whale scoop model take advantage of market behavior after a liquidity sweep?

    -The model exploits the market behavior where, after a liquidity sweep on one side (buy or sell), there is often an immediate reversal in the intended direction, causing a shift in market sentiment and attracting traders to the side where liquidity has yet to be cleared out.

  • What is considered a high probability setup in the whale scoop model?

    -A high probability setup in the whale scoop model occurs when liquidity below a recent low has been swept, triggering many stop losses, leading to a sharp increase in buying pressure and bullish momentum.

  • How does the whale scoop model identify valid patterns from a candlestick perspective?

    -The model identifies valid patterns by looking for a sequence of candles that sweep out a recent key area, followed by an immediate return to the key area's range and a rapid market shift. A critical rule is that none of the subsequent candles' bodies or wicks should exceed the initial candle that triggered the whale scoop.

  • What are the two main entry models for executing trades with the whale scoop trading strategy?

    -The two main entry models are the aggressive entry model, which uses a single time frame for analysis and trade execution, and the conservative entry model, which employs two different time frames for market analysis and entry confirmation.

  • How does the aggressive entry model work in the whale scoop model?

    -In the aggressive entry model, traders identify a valid whale scoop pattern and execute orders within the same time frame. They wait for an engulfing candle that engulfs the previous candles of the whale scoop and set their entry at the closure of this candle.

  • What is the conservative entry model in the whale scoop trading strategy?

    -The conservative entry model uses a higher time frame for market analysis and a lower time frame for entry confirmation and order execution. Traders switch to a lower time frame after detecting a valid whale scoop on the higher time frame and wait for a valid change of character pattern to confirm the market structure shift.

  • Why is backtesting important in trading, and what tool is mentioned in the video for this purpose?

    -Backtesting is crucial as it allows traders to evaluate the performance of a trading strategy before applying it to a real account. The video mentions the Trader Edge platform as a tool for backtesting exclusive trading strategies.

  • Can you provide an example of how the whale scoop model is applied in a real trade scenario?

    -In one of the examples provided, the price breaks below a structure with inefficiency, marking an unmitigated supply zone. After a brief pause, the price retraces upward, enters the supply zone, and triggers stop losses. The price then reverses direction, closing below the supply area with an engulfing candle, forming a valid whale scoop pattern. This scenario is an opportunity to execute a sell order using the aggressive entry model of the whale scoop model.

Outlines

00:00

πŸš€ Introduction to the Whale Scoop Trading Model

This paragraph introduces the 'Whale Scoop' trading model, emphasizing its potential to revolutionize market approach and significantly increase win rates. The speaker outlines the video's agenda, which includes a detailed explanation of the model, key concepts, candlestick patterns, entry models, time frames, and real chart examples. The importance of watching the entire video for a comprehensive understanding is stressed, and viewers are encouraged to support the channel.

05:02

🧠 The Whale Scoop Mindset and Strategy

The second paragraph delves into the mindset behind the Whale Scoop model, highlighting its reliance on liquidity sweeps and stop hunts in key static liquidity areas. The strategy involves buying or selling at these areas and targeting the opposite sides' external liquidity. The paragraph explains how the model capitalizes on market sentiment shifts post-liquidity sweep, aiming for high probability setups with good risk-reward ratios. It also discusses the importance of recognizing valid whale scoop patterns from a candlestick perspective.

10:04

πŸ” Identifying Valid Whale Scoop Patterns

This paragraph focuses on the technical aspect of identifying valid whale scoop patterns on price charts. It describes the characteristics of a proper whale scoop, including the importance of the initial candle's body or wick not being exceeded by subsequent candles. The paragraph provides examples of different candlestick whale scoops to illustrate the concept and discusses the significance of these patterns in indicating market reversals and capturing high win rate trades.

15:04

πŸ“ˆ Entry Models in Whale Scoop Trading

The fourth paragraph discusses the two main entry models for executing trades with the whale scoop strategy: aggressive and conservative. The aggressive entry model involves using a single time frame for analysis and execution, waiting for an engulfing candle to set entry and stop loss positions. The conservative entry model uses two time frames, with a higher time frame for analysis and a lower one for entry confirmation and order execution. The paragraph also touches on the importance of backtesting strategies and introduces the Trader Edge platform for this purpose.

20:05

πŸ€‘ Real Trade Examples Using the Whale Scoop Model

The final paragraph presents real trade examples to demonstrate the application of the whale scoop model. It details specific scenarios on the Euro Dollar 1-hour time frame, illustrating how the model identifies key supply zones and uses them to execute trades with high win rates. The paragraph concludes with a recap of the model's principles and an invitation for viewers to subscribe and engage with the channel for more informative content.

Mindmap

Keywords

πŸ’‘Whale Scoop Model

The Whale Scoop Model is an advanced trading strategy that focuses on identifying and exploiting liquidity sweeps in the market. It targets key static liquidity areas, such as major highs and lows or supply and demand zones, where the price often reverses direction after sweeping liquidity. The strategy is designed to capture significant market moves by entering trades at these critical points.

πŸ’‘Liquidity Sweep

A liquidity sweep refers to the process where the market price moves to clear out liquidity, typically around key support or resistance levels. In the Whale Scoop Model, a liquidity sweep often triggers a sharp reversal, providing traders with an opportunity to enter the market at favorable points. For example, when the price sweeps below a swing low, it can indicate a buying opportunity as sell stops are triggered.

πŸ’‘Stop Hunt

A stop hunt is a market phenomenon where the price moves to trigger stop-loss orders placed by traders. In the context of the Whale Scoop Model, stop hunts are used to clear out liquidity at key levels, which then leads to a reversal in price direction. The model takes advantage of this behavior to identify high-probability trade setups.

πŸ’‘Candlestick Patterns

Candlestick patterns are specific formations of price movement on a chart that can indicate potential market direction. In the Whale Scoop Model, certain candlestick patterns are crucial for identifying valid setups. These patterns, such as those involving long wicks or engulfing candles, signal the presence of a liquidity sweep and the potential for a price reversal.

πŸ’‘Entry Models

Entry models refer to the specific methods used to enter a trade based on the Whale Scoop strategy. The video describes two main entry models: the aggressive and the conservative. The aggressive model involves entering a trade on the same time frame where the Whale Scoop pattern is identified, while the conservative model requires confirmation on a lower time frame before executing the trade.

πŸ’‘Supply and Demand Zones

Supply and demand zones are areas on a price chart where the market has shown significant buying (demand) or selling (supply) interest. These zones are critical in the Whale Scoop Model as they often coincide with areas where liquidity is concentrated. The strategy involves looking for liquidity sweeps around these zones to identify potential trade setups.

πŸ’‘Fair Value Gap

A Fair Value Gap is an inefficiency in the market where the price moves quickly between two levels without trading in between, creating a 'gap.' In the Whale Scoop Model, fair value gaps are important as they often coincide with areas where liquidity has been swept. The model suggests that price tends to revisit these gaps before continuing in the direction of the trend.

πŸ’‘Change of Character

Change of Character (CHOCH) refers to a shift in market structure that indicates a potential reversal in price direction. In the Whale Scoop Model, detecting a CHOCH on a lower time frame after identifying a Whale Scoop pattern on a higher time frame is used as confirmation for entering a trade. It signals that the market sentiment has changed and a new trend may be emerging.

πŸ’‘Engulfing Candle

An engulfing candle is a candlestick pattern where a larger candle completely 'engulfs' the previous candle, signaling strong market momentum. In the Whale Scoop Model, an engulfing candle following a liquidity sweep is a key signal for entering a trade, as it indicates a strong shift in market sentiment in the direction of the trade.

πŸ’‘Risk-Reward Ratio

The risk-reward ratio measures the potential reward of a trade relative to its risk. In the Whale Scoop Model, trades are executed with a focus on maximizing the risk-reward ratio by entering at points where the potential for significant market movement is high, such as after a liquidity sweep. This ensures that the reward for successful trades outweighs the risk of losses.

Highlights

Introduction of the 'whale scoop' trading model, a strategy with the potential to greatly increase win rates.

Explanation of the core mindset behind the model, focusing on liquidity sweeps and stop hunts in key static liquidity areas.

Importance of recognizing immediate price reversals after a key static liquidity pool is cleared out.

Discussion on how the whale scoop model leverages market sentiment shifts post-liquidity sweep for trade setups with good risk-reward ratios.

Identification of the whale scoop as a high probability setup due to the triggering of many stop losses, leading to increased buying pressure.

Description of the whale scoop pattern on a candlestick chart, characterized by a sequence of candles that sweep out a recent key area.

Rule clarification that subsequent candles after a whale scoop should not exceed the initial candle's body or wick.

Examination of various candlestick whale scoop patterns to solidify understanding and discern validity.

Introduction of two main entry models for the whale scoop strategy: aggressive and conservative.

Details on the aggressive entry model, which involves executing orders within the same time frame as analysis.

Explanation of the conservative entry model using two different time frames for analysis and entry confirmation.

Emphasis on backtesting trading strategies, recommending at least 100 iterations before live application.

Presentation of real trade examples demonstrating the execution of trades using the whale scoop model.

Analysis of a specific trade example showcasing the successful application of the whale scoop model in a bearish market scenario.

Discussion on the significance of aligning a liquidity sweep with fair value mitigation in the context of the whale scoop strategy.

Highlight of the importance of market analysis time frame being at least twice as long as the entry time frame for effective trading.

Encouragement to subscribe and engage with the channel for updates on trading strategies and techniques.

Transcripts

play00:00

hey Traders welcome to another episode

play00:02

of smart risk today we finally share one

play00:05

of our exclusive trading plans the whale

play00:08

scoop model this exclusive trading model

play00:11

could revolutionize the way you approach

play00:13

the market a strategy that has the

play00:15

potential to Skyrocket your win rates in

play00:18

this episode we're going Beyond Theory

play00:20

and we'll walk you through the whale

play00:21

scoop model step by step breaking down

play00:24

the key points and all Concepts that you

play00:26

need to master this Advanced trading

play00:28

model the all you need is to make sure

play00:30

that you don't skip any part of this

play00:32

video and watch carefully we always

play00:34

appreciate your support so please give

play00:36

this video a thumbs up and subscribe to

play00:38

our Channel if you are new see you after

play00:42

[Music]

play00:50

intro welcome back Traders so let's get

play00:54

started we have simplified everything

play00:56

you need to know about this strategy to

play00:58

get the most out of it watch the entire

play01:00

video without skipping any parts the

play01:03

whale scoop model has the potential to

play01:05

become your Cornerstone trading strategy

play01:07

helping you become a consistently

play01:09

profitable

play01:10

Trader in this episode we will cover the

play01:14

core mindset behind the whale scoop

play01:16

model the exact Candlestick patterns

play01:19

involved the specific entry models the

play01:22

appropriate time frames for executing

play01:24

trades the various forms of the whale

play01:27

scoop real chart examples to solidify

play01:30

your understanding now let's start with

play01:32

part one the mindset behind the whale

play01:34

scoop

play01:36

model the key to fully understanding the

play01:39

whale scoop model is recognizing that it

play01:41

involves a liquidity sweep and stop hunt

play01:43

of key static liquidity areas such as

play01:46

major highs and lows key supply and

play01:48

demand zones and so on it's all about

play01:51

buying or selling at these external

play01:53

range liquidity areas and targeting the

play01:55

opposite sides external liquidity in the

play01:57

market for example as you can see here

play02:01

we have a low when trading the whale

play02:03

scoop model if the price sweeps the

play02:05

liquidity below a key structure like

play02:07

this swing low the strategy would

play02:09

involve buying those sell stops and then

play02:11

holding for the opposing liquidity the

play02:13

main practice point of a whale scoop is

play02:15

that once the price takes out a key

play02:17

static liquidity pool we often see an

play02:19

immediate reversal in the intended

play02:21

Direction the core idea behind the whale

play02:24

scoop plan is straightforward when sside

play02:26

liquidity is cleared out through a

play02:28

liquidity sweep or whale scoop the price

play02:30

often moves towards the buy side

play02:31

liquidity which aligns with the Market's

play02:34

overall

play02:35

direction when the price sweeps

play02:37

liquidity on one side whether buy or

play02:39

sell it usually causes a shift in Market

play02:42

sentiment Traders then tend to follow

play02:45

this new momentum looking for

play02:47

opportunities on the side where

play02:48

liquidity hasn't been cleared out yet

play02:50

the whale scoop model takes advantage of

play02:52

this Behavior using the interaction

play02:54

between these liquidity zones to find

play02:56

trade setups with good risk reward

play02:58

ratios so why should we consider the

play03:01

whale scoop as a high probability

play03:04

setup in this scenario we consider this

play03:07

pattern a high probability setup because

play03:09

the liquidity below the recent low has

play03:11

already been swept this means that many

play03:14

stop losses have been triggered leading

play03:16

to a sharp increase in buying pressure

play03:18

and bullish momentum as a result Traders

play03:21

have limited time and opportunities to

play03:23

execute orders in that area and adjust

play03:26

their stop

play03:27

losses beneath the lowest point of the

play03:29

recent whale scoop there is no

play03:31

considerable volume of pending orders

play03:34

indicating that the price has no

play03:35

tendency to push lower additionally

play03:38

since the price has started to move

play03:40

upward with significant momentum it

play03:42

signals a strong bullish bias this makes

play03:45

more Traders believe that the Price's

play03:47

retracement phase is finished and will

play03:49

continue its primary

play03:51

uptrend this action induces more Traders

play03:53

into the market executing long positions

play03:56

to gain profits resulting in massive

play03:58

buying momentum over specific

play04:01

period these scenarios make the whale

play04:03

scoop model a reliable trading method

play04:05

that provides a high probability of

play04:07

success when used

play04:09

properly now let's proceed to the next

play04:11

section and examine how to identify a

play04:13

valid whale Scoop from a Candlestick

play04:16

perspective as previously mentioned the

play04:19

core concept of the whale scoop model is

play04:20

to identify valid liquidity sweep

play04:22

patterns on the chart therefore one of

play04:25

the most crucial and challenging steps

play04:27

in this trading strategy is to

play04:29

accurately identify the proper whale

play04:30

scoop pattern on the price chart the

play04:33

proper whale scoop is characterized by a

play04:35

sequence of candles which may consist of

play04:37

a single long candle or a series of

play04:40

multiple candles that sweeps out a

play04:42

recent key area such as swing highs

play04:45

swing lows or supply and demand zones

play04:48

then price immediately returns to the

play04:50

key area's range and initiates a rapid

play04:53

and substantial Market

play04:55

shift the whale scoop often features a

play04:57

long Wick especially on higher time

play04:59

frames and typically appears through a

play05:01

series of candles the critical rule is

play05:04

that none of the subsequent candles

play05:06

bodies or Wicks should exceed or close

play05:09

higher or lower than the body or Wick of

play05:11

the initial candle that triggered the

play05:12

whale scoop and swept the

play05:15

liquidity for example here we can see

play05:18

that the price swept the liquidity of a

play05:19

previous key area with a long Wick and

play05:22

then closed below the range of the key

play05:24

area representing a valid whale scoop

play05:27

pattern typically the price does not

play05:30

form a whale scoop pattern as cleanly as

play05:32

this one when you start identifying

play05:34

whale scoops on the chart you'll

play05:36

encounter various patterns that might

play05:37

confuse you about their validity to

play05:40

address this let's examine more examples

play05:42

of different Candlestick whale Scoops to

play05:44

gain a solid understanding of this

play05:47

topic starting with example number one

play05:50

the price performed a whale scoop in a

play05:51

two candle sequence the first candle

play05:54

initiated the liquidity sweep by taking

play05:56

out the highest point of a major swing

play05:57

high with strong momentum and closing

play05:59

closing above it then the price

play06:01

immediately pushed lower into the range

play06:03

of the key area with the following

play06:05

candle please note that this is the only

play06:08

type of whale scoop pattern that can be

play06:10

considered a sign of manipulation

play06:11

indicating an upcoming reversal in price

play06:14

Direction typically closing above a

play06:17

major High signals a continuation in

play06:19

price Direction not a

play06:23

reversal in this example we can see that

play06:26

the price swept the liquidity above the

play06:27

previous key area with a long Wick and

play06:30

then closed below the range of the key

play06:32

area the price finally fell after

play06:34

pushing a bit higher with the subsequent

play06:36

candles forming a perfect whale scoop

play06:39

this pattern is considered a valid whale

play06:40

scoop because none of the subsequent

play06:42

candles exceeded the first candle's Wick

play06:44

or its highest

play06:46

point in the next example we have a

play06:49

perfect two candle sequence forming a

play06:50

whale scoop showcasing the strength of

play06:53

this trading

play06:54

model after sweeping the liquidity above

play06:56

the previous key area with the wick of

play06:58

the first candle the price closed below

play07:00

the key area's range and immediately

play07:02

reversed direction to the

play07:04

downside in the whale scoop trading

play07:07

model we aim for trades with the highest

play07:09

possible win rate and the safest entries

play07:11

capturing significant Market moves like

play07:14

this large red bearish

play07:16

candle in the last example we see that

play07:19

after taking the liquidity above a key

play07:21

area the price returned to the key area

play07:24

range however instead of pushing lower

play07:26

immediately the price paused within the

play07:28

range of the pen penetration candle

play07:30

before starting to move lower this also

play07:33

indicates a valid whale scoop

play07:35

pattern now that we've covered the

play07:37

various Candlestick forms of the whale

play07:39

scoop let's move on to the next section

play07:42

and look at the different entry models

play07:43

you can use with the whale scoop trading

play07:47

strategy there are two main entry models

play07:49

for executing trades with the whale

play07:51

scoop the aggressive and conservative

play07:53

entry

play07:56

models using the aggressive entry model

play07:58

in smart money Concepts or ICT is

play08:01

similar to placing a limit order within

play08:03

the higher time frames demand or Supply

play08:05

Zone however with the whale scoop model

play08:08

it's a bit different in the aggressive

play08:11

entry model we use a single time frame

play08:13

for both analysis and trade execution

play08:15

this involves identifying the proper

play08:17

whale scoop pattern and executing orders

play08:19

within the same time

play08:21

frame here's how it works after

play08:24

identifying a valid whale scoop wait for

play08:27

the price to form an engulfing candle

play08:29

that engulfs the previous candles of the

play08:31

whale scoop once you see this set your

play08:34

entry at the closure of the engulfing

play08:36

candle for the stoploss position it a

play08:39

few Pips above or below the whale

play08:41

scoop's penetration

play08:43

candle if you want a better reward to

play08:45

risk ratio you can set it a couple of

play08:48

Pips above or below the engulfing candle

play08:51

instead for the takeprofit we should

play08:53

Target the closest external liquidity

play08:55

areas on the

play08:57

chart we prefer not to keep our

play08:59

positions open for an extended period

play09:01

since our entry is executed on a higher

play09:03

time

play09:04

frame we use 30 minute 1our 2hour and 4H

play09:09

hour time frames to apply this entry

play09:11

model these are the only applicable time

play09:14

frames for this

play09:15

method now let's look at an advanced

play09:18

pattern of the whale scoop trading model

play09:20

which uses the aggressive entry model to

play09:22

execute

play09:27

trades as you analyze the charts this

play09:30

setup is one of the key trading

play09:31

opportunities to look out for in this

play09:34

example the supply zones are in control

play09:37

and the price has formed a bearish

play09:38

structure like the one

play09:40

shown after the initial downward

play09:42

movement the price returned to the

play09:44

latest Supply area this acted as an

play09:46

inducement area triggering the stop-loss

play09:49

orders of traders who had entered short

play09:51

trades from that

play09:52

level the price then moved higher toward

play09:55

the second unmitigated Supply Zone

play09:57

tapping into it and M ating the order

play10:00

block it then surged upward sweeping the

play10:03

liquidity accumulated above the order

play10:06

block as the price used the lowest

play10:08

unmitigated Supply area as an inducement

play10:10

and triggered sellers stop-loss orders

play10:13

more Traders may be tempted to execute

play10:15

short trades from the upper order block

play10:18

these actions create a significant

play10:19

liquidity pool just above the second

play10:21

Supply Zone attracting the market to

play10:23

move towards this liquidity to fuel its

play10:26

momentum now we see that after the price

play10:29

whale scooped the liquidity above the

play10:30

supply Zone and mitigated the upper fair

play10:32

value Gap It reversed direction and

play10:35

continued its bearish movement to the

play10:38

downside the key factor to consider in

play10:40

this pattern is that the price must

play10:42

whale scoop the liquidity accumulated

play10:44

below or above the supply or demand

play10:46

areas fill the fair value Gap and then

play10:49

immediately re-enter the supply or

play10:51

demand range within a few candles we

play10:53

need to see an immediate liquidity sweep

play10:55

along with the mitigation of a fair

play10:57

value gapos

play10:59

you were to ask about the psychology

play11:00

behind this strategy and its

play11:02

significance in that case I'd highlight

play11:05

the importance of aligning a liquidity

play11:06

sweep of an order block with fair value

play11:09

mitigation this alignment ensures

play11:11

there's no lingering buy side liquidity

play11:13

like the liquidity void of a fair value

play11:16

Gap or the liquidity created by the stop

play11:18

losses of sellers remaining in the

play11:20

market when there's no buy-side

play11:22

liquidity left to be swept the price

play11:24

will likely move sharply towards the

play11:26

cell-side liquidity aligning with the

play11:28

dominant Market

play11:30

Direction first we must identify a valid

play11:33

whale scoop pattern to take advantage of

play11:35

this Advanced trading model and execute

play11:37

a position once we have the necessary

play11:40

confluences we should wait for the price

play11:42

to form an engulfing candle then we can

play11:45

place a sell order at the closure of the

play11:47

engulfing

play11:48

candle this was the perfect example of

play11:50

the whale scoop model I always look for

play11:52

to enter a position in the market the

play11:55

same concept applies to bullish

play11:57

scenarios now let's move on to to the

play11:59

conservative entry model but before we

play12:01

continue it's important to note a

play12:03

crucial step in your trading Journey

play12:05

Back testing your

play12:07

strategies before applying any strategy

play12:09

to your real account it's recommended

play12:11

that you back test it at least 100 times

play12:14

to help you with this critical step we

play12:17

use the trader Edge platform for back

play12:19

testing our exclusive trading strategies

play12:22

if you're interested in using Trader

play12:23

Edge as your back testing tool be sure

play12:25

to check out the link in the description

play12:27

below in the conservative entry method

play12:29

of the whale scoop plan we employ two

play12:32

different time frames for our trading

play12:33

approach a higher time frame for market

play12:36

analysis and a lower time frame for

play12:38

entry confirmation and Order

play12:40

execution to apply the conservative

play12:43

entry method after detecting a valid

play12:45

whale scoop on the higher time frame the

play12:47

next step is to switch to a lower time

play12:49

frame closely monitor the price movement

play12:51

and patiently await the formation of a

play12:53

valid change of character

play12:55

pattern after detecting the confirmation

play12:58

of Market structure shift on the entry

play13:00

time frame we should set our entry at

play13:02

61.8% of the Fibonacci level of the

play13:05

change of character wave with a stop

play13:07

loss put a few Pips below the whale

play13:09

scoop's lowest point for the takeprofit

play13:12

we can set it at the closest external

play13:14

liquidity of the entry time frame or if

play13:17

you would like to have a higher R to R

play13:19

you need to place your TP at the higher

play13:21

time frames key

play13:23

areas alternatively you can set your

play13:26

entry position on the order Block in

play13:28

this case a demand Zone on the lower

play13:31

time frame which is created by the

play13:33

change of the character's wave you can

play13:36

also set your entry position on the fair

play13:39

value gaps attributed to the change of

play13:41

the character's rally wave however I

play13:44

prefer to execute my entry at the

play13:47

61.8% level of the Fibonacci retracement

play13:50

drawn from the change of the character's

play13:53

wave before proceeding to the real chart

play13:56

examples and seeing how we can execute

play13:58

trades with the whale scoop model let's

play14:00

quickly break down its time

play14:03

frames I prefer using the 1hour time

play14:06

frame for market analysis identifying my

play14:08

whale scoop and then switching to the

play14:10

5minute time frame for executing my

play14:13

trades however depending on your

play14:15

preference you can choose other time

play14:17

frame combinations like the 15 minutes

play14:19

for identifying whale Scoops and 1

play14:21

minute for the entry or the 4 hours and

play14:23

15

play14:24

minutes also if your whale scoop is

play14:27

formed on a daily time frame you your

play14:29

entry should be executed in 1H hour time

play14:31

frame and if your whale scoop is formed

play14:33

on a monthly time frame you can use the

play14:35

daily time frame for entering the market

play14:38

the key principle is that your market

play14:40

analysis time frame should be at least

play14:41

twice as long as your entry time frame

play14:44

also there are specific times on the

play14:46

chart when the whale scoop plan is more

play14:48

likely to be successful than other times

play14:50

and we will explain these in the next

play14:52

episodes of the whal scoop trading model

play14:54

now that we have fully covered the

play14:56

basics of the whale scoop model let's

play14:58

examine some real trade

play15:01

examples here we have the euro dollar

play15:03

1hour time frame on the screen as you

play15:06

can see the price is on a downtrend

play15:09

forming a series of break of structures

play15:10

to the

play15:12

downside starting from the top the price

play15:15

broke below this structure with

play15:17

inefficiency marking an unmitigated

play15:19

Supply Zone at the extreme following

play15:22

this the price experienced a brief pause

play15:24

before resuming its downward

play15:26

movement along its downward TR trory it

play15:29

Formed two successive breaks of

play15:31

structures and established two

play15:33

unmitigated Supply

play15:35

areas in the subsequent price action we

play15:38

witnessed a Slowdown in the bearish

play15:40

momentum after a brief pause and the

play15:43

formation of buy side liquidity below

play15:45

the swing points the price retraced

play15:47

upward and entered the most recent

play15:49

unmitigated order

play15:50

block following this it pushed above the

play15:53

Zone triggering the stop losses of

play15:56

sellers however it quickly reversed its

play15:59

Direction and closed below the order

play16:00

block with an engulfing

play16:02

candle this sequence of events likely

play16:04

encouraged more traders to enter sell

play16:06

positions and place their stop losses

play16:08

Above This Zone their rationale may have

play16:11

been that since the price had swept the

play16:13

sell-side liquidity above the order

play16:14

block and closed below the supply area

play16:17

with an engulfing candle Traders

play16:19

anticipated continuing the price

play16:20

movement toward the sells side liquidity

play16:22

below the swing points however what

play16:25

occurred was a trap for sellers the

play16:27

price trapped sellers twice twice a row

play16:29

and utilized this Supply Zone as a

play16:31

strong inducement by triggering the stop

play16:33

losses of traders who had entered short

play16:35

trades from that

play16:37

area following this we see the price

play16:40

triggering the stop losses of traders

play16:42

who had entered their positions based on

play16:43

confirmation from the most recent

play16:45

unmitigated Supply area subsequently the

play16:48

price moved higher toward the second

play16:50

unmitigated Supply Zone as the price

play16:52

used the lowest unmitigated Supply area

play16:55

as a strong inducement and triggered the

play16:57

stop losses of sellers in two sep seate

play16:59

steps more Traders were encouraged to

play17:01

execute short trades from this upper

play17:03

order block however contrary to

play17:06

expectations the price did not respect

play17:08

the second Supply Zone instead it surged

play17:11

above sweeping the liquidity associated

play17:14

with sellers stop losses from this Zone

play17:16

and forming a valid whale scoop pattern

play17:18

since the price has whale scooped a key

play17:20

Supply after filling the only fair value

play17:22

Gap above the order block the price

play17:24

promptly entered the range of the supply

play17:26

zone so in this trading scenario we have

play17:29

an immediate liquidity sweep of a key

play17:30

Zone and a fair value Gap mitigation

play17:33

that indicates a particular scenario of

play17:35

the whale scoop model we covered in this

play17:37

video's previous

play17:38

part so we have the desired Confluence

play17:41

we sought in our analysis in the next

play17:44

step we must execute a sell order and

play17:46

enter the market for that I'll use the

play17:48

whale Scoops aggressive entry model and

play17:51

place my entry at the closure of the

play17:52

engulfing candle which is below the

play17:54

supply area as for the stop loss I'll

play17:58

position it a few Pips above the highest

play18:00

point of the upper candles I am

play18:02

targeting the sell-side liquidity below

play18:04

the swing point for the takeprofit we

play18:06

prefer not to keep our positions open

play18:08

for an extended period as our entry was

play18:10

executed within 1 hour now let's play

play18:13

out our trade as you can see the price

play18:16

pushed lower and lower with a great

play18:17

bearish momentum candle and finally hit

play18:20

the takeprofit this was the perfect

play18:22

example of the whale scoop model I

play18:24

always sought to enter into the market

play18:27

position now let's move on to the

play18:29

following trade

play18:31

example here we have the euro dollar

play18:33

1hour time frame on the chart as you can

play18:36

see price is in a downtrend and has also

play18:39

created several breaks of structures to

play18:41

the downside if we zoom into a 15-minute

play18:44

time frame we can see that the price

play18:47

sharply cleared the liquidity Above This

play18:49

high with a long Wick following this the

play18:52

price immediately reversed and closed

play18:54

below the highs range creating a whale

play18:56

scoop

play18:57

pattern so we have identified a valid

play19:00

whale scoop pattern in the 15-minute

play19:02

time frame in the next step we need to

play19:04

execute a sell order and enter the

play19:06

market for that I'll use the whale

play19:08

scoop's conservative entry model to do

play19:11

that I am going to zoom into the one

play19:12

minute time frames price chart and wait

play19:15

for price to form a change of

play19:18

character here we have the one minute

play19:20

time frame chart as you can see price

play19:23

created a perfect change of character by

play19:25

breaking and closing below this

play19:26

structure to the downside leaving an

play19:29

incredible inefficiency behind in the

play19:31

next step we must execute a sell order

play19:34

and enter the

play19:35

market I'm placing sell limit orders at

play19:37

the

play19:38

0.618 level of Fibonacci retracement to

play19:41

ensure risk management I'm setting the

play19:44

stop losses a few Pips above the highest

play19:46

point of the most recent swing high for

play19:48

having a tight stop loss as for the

play19:50

take-profit Target I've decided to set

play19:52

it at this recent swing low I anticipate

play19:55

that the price will move in that

play19:57

direction now that we have placed our

play19:59

sell limit order let's see how the

play20:00

market reacts and whether our trade

play20:02

setups play out successfully as the

play20:04

trade progresses we can see that the

play20:06

price initiates a downward movement once

play20:08

our initial sell limit order is

play20:11

executed eventually the price reaches

play20:13

our preset take profit Target this trade

play20:16

has yielded a promising reward to risk

play20:18

ratio demonstrating a successful result

play20:21

now let's go ahead and look at another

play20:25

example once more we have Euro doll

play20:28

15minute time frame chart if we take a

play20:30

closer look at the chart we see that

play20:32

price has taken out the liquidity above

play20:34

this structure by a single red candle

play20:36

here followed by an immediate push in

play20:38

price to the downside with the price

play20:41

returning to the range below the range

play20:43

of previous High consequently we've

play20:46

pinpointed a whale scoop pattern now we

play20:49

have a valid whale scoop pattern let's

play20:51

zoom into the one minute time frame to

play20:53

obtain a clearer view of price action

play20:55

and search for any sign of change of

play20:57

character pattern

play20:59

now shifting our Focus to the one minute

play21:01

time frame chart we see that the price

play21:04

has created a change of character by

play21:06

breaking and closing below this

play21:07

structure to the downside thereby

play21:09

leaving behind a significant

play21:12

inefficiency now everything looks

play21:15

perfect in the next step we need to

play21:17

execute a sell order and enter the

play21:19

market I'll place a sell limit order at

play21:22

the

play21:22

0.618 Fibonacci retracement level to do

play21:25

that this approach offers the advantage

play21:28

of an optimized entry point and a

play21:30

narrower stop loss it also reduces the

play21:33

likelihood of trade losses because

play21:34

placing a sell limit order solely on the

play21:36

order block could result in missing out

play21:38

on a prime trading opportunity to

play21:41

maintain a strong risk management

play21:43

strategy I'll place the stop loss a few

play21:45

Pips above the whale scoop pattern's

play21:47

highest

play21:48

point my focus for the take-profit

play21:50

Target is set on this particular swing

play21:52

low as it presents a significant level

play21:54

at which we expect the price to

play21:56

potentially reach now that we have

play21:58

placed our sell limit order let's see

play22:01

how the market reacts and whether our

play22:02

trade setups

play22:04

work as you can see the price was pushed

play22:07

lower after the sell limit order was

play22:09

triggered and eventually reached the

play22:10

take-profit

play22:11

target that's it Traders thank you for

play22:14

watching this video I hope you found it

play22:16

informative and useful don't forget to

play22:18

hit the Subscribe button and turn on

play22:20

notifications to stay updated on our

play22:22

latest videos we value your feedback and

play22:25

suggestions so please leave your

play22:26

comments below and let us know what what

play22:28

topics you'd like us to cover in our

play22:30

future videos we appreciate your support

play22:32

and look forward to seeing you in the

play22:34

next episode

Rate This
β˜…
β˜…
β˜…
β˜…
β˜…

5.0 / 5 (0 votes)

Related Tags
Trading StrategyWhale ScoopMarket AnalysisLiquidity ZonesRisk ManagementTechnical AnalysisProfitabilityCandlestick PatternsTrading PsychologyOrder Blocks