The ONLY Candlestick Pattern Guide You'll EVER NEED
Summary
TLDRThis video script delves into the art of candlestick pattern analysis for successful trading. It highlights the importance of identifying patterns like the engulfing candle, momentum candle, and multiple candlestick patterns to predict market direction. The script also touches on the significance of doji, hammer, shooting star, tweezer, and marubozu patterns, offering insights into market reversals and trends. A bonus tip introduces using TradingView indicators to spot these patterns effortlessly, aiming to enhance viewers' trading strategies and avoid false breakouts.
Takeaways
- π The video discusses a recent successful trade that resulted in a 10% gain, highlighting the importance of candlestick patterns in predicting market movements.
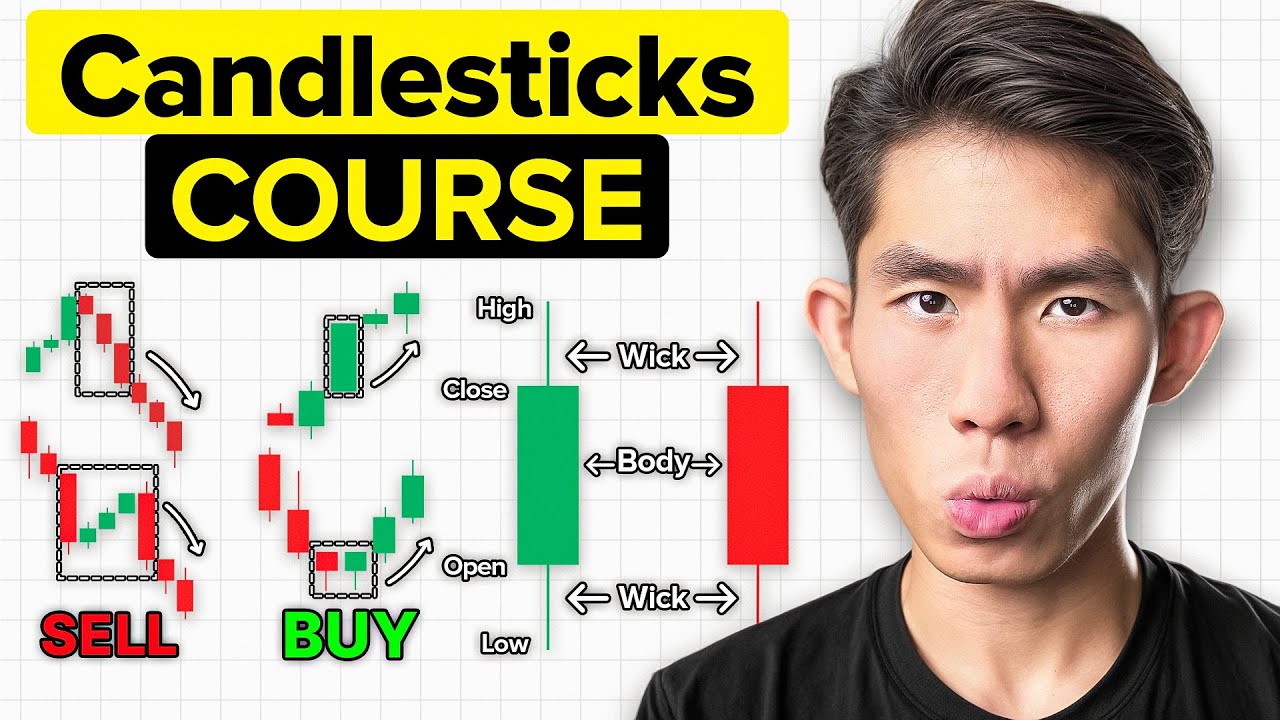
- π―οΈ The 'Engulfing Candle' is a strong reversal pattern where a candle of the opposite color completely engulfs the previous candle, signaling a potential trend reversal.
- π The 'Momentum Candle' is a large candle, two to three times bigger than the previous ones, indicating a strong directional move that is likely to continue.
- π The 'Multiple Candlestick Pattern' involves three or more candles with wicks going in the same direction, suggesting a higher probability of the price respecting the pattern and moving accordingly.
- π¬ The 'Doji Candle' represents market indecision and is often followed by a reversal, especially when confirmed by additional candles of the same color.
- β The 'Hammer' is a bullish pattern with a small body and a long lower wick, indicating that buyers have absorbed selling pressure and may drive the price up.
- π The 'Shooting Star' is similar to the hammer but with a small body and a long upper wick, suggesting a potential bearish reversal.
- πͺ’ The 'Tweezer' pattern consists of a red and a green candlestick with similar lower wicks, indicating potential upward momentum, with the bearish version having upper wicks.
- π’ The 'Bullish Marubozu' is a green candlestick without wicks, signaling strong buying pressure and a likely continuation of the upward trend.
- π΄ The 'Bearish Marubozu' is a red candlestick without wicks, indicating strong selling pressure and a probable continuation of the downward trend.
- π οΈ TradingView can be used to add candlestick pattern indicators, which automatically highlight when specific patterns occur, aiding in pattern recognition without memorization.
Q & A
What is the main topic of the video?
-The main topic of the video is candlestick patterns and how they can be used to predict market direction and improve trading strategies.
What is an 'engulfing candlestick' and how does it indicate a potential market reversal?
-An 'engulfing candlestick' is a candle that is in the opposite color of the previous one and completely covers it, indicating a potential market reversal at the point where it appears.
Why is it important to combine candlestick patterns with other trading tools and strategies?
-Combining candlestick patterns with other trading tools and strategies helps to avoid relying solely on patterns, which can sometimes be misleading, and provides a more comprehensive approach to trading.
What is a 'momentum candle' and how can it be used in trading?
-A 'momentum candle' is a large candle that is two to three times bigger than the previous candles. It can be used in trading as an indicator that the price is likely to continue in the direction of the candle, especially in choppy markets.
How can the 'multiple candlestick pattern' be used to identify key support or resistance levels?
-The 'multiple candlestick pattern', which consists of three or more candles with wicks going in one direction, can be used to identify key support or resistance levels when these candles appear exactly at these levels, indicating a higher probability of price reversal.
What does a 'doji candle' represent and how can it be used as a trading signal?
-A 'doji candle' represents market indecision and can be used as a trading signal for a potential price reversal, especially when it appears after a strong trend and is followed by additional confirming candles of the opposite color.
What is the significance of a 'hammer candle' in predicting market direction?
-A 'hammer candle', characterized by a small body and a long lower wick, signifies that buyers have absorbed the selling pressure and pushed the price back up, indicating a bullish signal and potential continuation of the upward trend.
How does a 'shooting star candle' differ from a 'hammer candle' and what does it indicate?
-A 'shooting star candle' is similar to a 'hammer candle' but has a small body and a long upper wick. It indicates a bearish signal, suggesting that the price may reverse and start moving downwards after a strong upward trend.
What is the 'tweezer pattern' and how can it signal a potential market move?
-The 'tweezer pattern' consists of a red candlestick followed by a green one, both with similar wicks on the bottom, signaling a potential upward move. Conversely, a green followed by a red with similar wicks on the top signals a potential downward move.
What is a 'marubozu candle' and how can it confirm the continuation of a trend?
-A 'marubozu candle' is a large candle without any wicks, indicating that the opening and closing prices were the same for the bullish version and that the trend is likely to continue in the upward direction. The bearish version indicates a downward trend continuation.
How can trading platforms like TradingView assist in identifying candlestick patterns?
-Trading platforms like TradingView can assist by providing indicators that notify traders when specific candlestick patterns occur, making it easier to spot these patterns without having to memorize and manually identify them.
Outlines
π Trading Success with Candlestick Patterns
The speaker shares their recent successful trade that yielded a 10% gain, attributing it to their understanding of candlestick patterns. They introduce the concept of candlestick patterns as a tool for predicting market direction and becoming a more successful trader. The video promises to share favorite patterns used daily, starting with the 'engulfing candle', which signals a reversal in market direction. The speaker emphasizes the importance of using candlestick patterns alongside other analysis tools, such as support and resistance levels and indicators, rather than relying solely on them for trading decisions.
π Advanced Candlestick Pattern Analysis
This paragraph delves into various candlestick patterns and their implications for trading. The 'momentum candle', characterized by its large size relative to previous candles, is highlighted as a powerful indicator, especially in choppy markets. The 'multiple candlestick pattern', where three or more candles show wicks in the same direction, is another key pattern discussed, often signaling a strong market sentiment. The 'doji candle', with its thin body and wicks on both sides, indicates market uncertainty and potential reversal. The 'hammer' and 'shooting star' patterns are explained as signs of strong buying or selling pressure, respectively. The 'tweezer' pattern, consisting of two candles with similar wicks, suggests an upcoming price movement in the direction of the wicks. Lastly, the 'marabozu' pattern, a large candle without wicks, indicates strong control by buyers or sellers, suggesting the continuation of the current trend.
π Bonus Tip: Utilizing TradingView for Pattern Recognition
As a bonus for viewers who reached the end of the video, the speaker provides a tip on how to use TradingView to identify candlestick patterns. By using the platform's indicators tab and selecting specific patterns, viewers can receive notifications when these patterns appear on their charts. This feature simplifies the process of spotting patterns without the need for memorization. The speaker also mentions the issue of false breakouts, where patterns suggest a certain market movement that does not occur, and invites viewers to watch another video for strategies to avoid such pitfalls. The video concludes with a call to action for viewers to like the video and a teaser for additional trading strategies.
Mindmap
Keywords
π‘Candlestick Pattern
π‘Engulfing Candle
π‘Momentum Candle
π‘Multiple Candlestick Pattern
π‘Doji Candle
π‘Hammer Candle
π‘Shooting Star
π‘Tweezer Pattern
π‘Marubozu
π‘False Breakout
π‘TradingView
Highlights
Introduction to the importance of candlestick patterns in predicting market movements and enhancing trading success.
Explanation of the Engulfing Candlestick as a strong reversal signal, with a detailed description and example.
The significance of support and resistance levels in conjunction with the Engulfing Candlestick for trade confirmation.
Caveats about relying solely on candlestick patterns for trading decisions, emphasizing the need for additional tools and strategies.
Illustration of a Bearish Engulfing Candlestick at resistance levels as an indicator for short positions.
Introduction to the Momentum Candlestick, characterized by its size and its impact on market direction in choppy markets.
The role of the Momentum Candlestick in signaling the continuation of market direction post sideways movement.
Description of the Multiple Candlestick Pattern and its effectiveness when combined with support and resistance analysis.
The Doji Candlestick's role in indicating market uncertainty and potential reversals.
Advice on confirming Doji Candlestick signals with additional same-colored candles for increased reliability.
Explanation of the Hammer Candlestick as a bullish sign after a period of selling pressure.
The Shooting Star Candlestick's resemblance to the Hammer and its implications for potential market reversals.
The Tweezer Candlestick Pattern's indication of an upcoming upward movement when identified correctly.
The Marabozu Candlestick Pattern's significance in confirming the continuation of an existing trend.
A bonus tip on using TradingView indicators to automatically identify candlestick patterns, reducing the need for memorization.
Acknowledgment of the issue of false breakouts in candlestick pattern trading and a teaser for a strategy to avoid them.
A call to action for viewers to like the video and an invitation to learn more about avoiding false breakouts in a follow-up video.
Transcripts
here's a recent trade i just finished a
huge 10 gain and massive profit helping
out my portfolio so much how did i know
this chart was about to go up because of
this candlestick pattern right here and
in this video i'm gonna share my
favorite candlestick patterns just like
this one that i use on a daily basis
that way you can read and understand
chart patterns predict chart direction
become a more successful trader and make
plays just like this one let's get
straight to it shall we
[Music]
one of my favorite and most used
candlestick patterns i like to trade
with is the engulfing candle i've used
it in many of my previous videos it's
such a strong candlestick because it can
give you the exact point of when a
reversal is about to happen what is an
engulfing candlestick well it basically
explains itself in the name it's a
candlestick in the opposite color of the
previous candle and it simply engulfs it
a bullish engulfing candle opens at or
is lower than the previous candles close
and closes above the previous candles
open so basically being bigger than the
previous candle on both sides making it
look as if it's engulfing it let me show
you an example so here we found a pretty
strong support where price bounced off
it multiple times telling us it really
respects it we see the price comes back
down to the support we can expect it to
bounce back up but before entering we
need a little more confirmation rather
than just assuming the support will hold
that's when we see a bullish engulfing
candle it completely engulfs the
previous red candle and is exactly at
the support this is an extremely bullish
sign and we can be pretty confident the
price will go up from here so we enter
the trade and look what happens now it's
also important to note that just because
there is a bullish or bearish engulfing
candle doesn't mean the price is going
to reverse in that direction every time
you shouldn't be just trading purely off
candlestick patterns you should be using
them as almost if they were hints on
which way the market is about to go not
pure decision makers you should be using
other tools with candlestick patterns
like support and resistances indicators
different strategies etc so just to be
clear just because you see a bullish
engulfing candle doesn't mean the price
will go up from there but it can be a
good indicator that the price will head
in that direction let me show you a
bearish example so here we have the same
type of setup a strong resistance where
the price respected it multiple times
before and we see the price comes back
up and starts to slow down giving us a
bearish engulfing candle completely
engulfing the previous green candle we
see that it got rejected at the
resistance and there was a bearish
engulfing candle indicating this is a
good sign to go short and look what
happens price goes down next we have the
momentum candle the momentum candle is a
lot easier to spot than the engulfing
candle purely because of its size a
momentum candle is simply a candle that
is two to three times bigger than the
previous candles before it this candle
can be insanely powerful because most of
the time after it happens the price will
continue to go in that direction making
this point a great time to enter the
most efficient and effective way to use
this candlestick pattern is in choppy
markets where the price is moving
sideways if you ever see a sideways
market then a huge momentum candlestick
appears being two to three times bigger
than the previous candles you can be
pretty certain that the price will
continue in that direction why is that
well think of it like this whenever
there is a sideways market like this
there are a lot of shorters stuck in
their trades they don't want to exit
their trade yet because the price is
moving sideways and it can honestly
still move in either direction they draw
their support and resistance and set
their stop losses right above the
support so that means they're going to
be tons of traders setting stop losses
all over this area meaning if there's a
sudden price movement and price hits
this liquidation zone all these stop
losses will be hit just adding fuel to
the fire for this price to keep moving
up also when price breaks a choppy
market like this it'll usually start a
trend in that direction it's the same
type of strategy with shorts if there's
a choppy sideways market and you see a
huge red candle two to three times
bigger than the candles before it this
is a great indicator to enter a short
position because it's likely the price
will continue to move downwards next we
have the multiple candlestick pattern
this is one of my favorites as it
usually holds pretty true on charts and
it's also pretty simple all it is is
when you have three or more candles that
have wicks going one direction the more
candles the better i like to pair this
candlestick pattern with support and
resistances so look at this chart what
do you see happening well for one we
have a key support where price bounces
off multiple times then we have multiple
candles with wicks going downwards
exactly at the support as you can see
all these candles have downward wicks
telling us that sellers are trying to
break the support but buyers keep
fighting them off and are winning
multiple times confirming that this is a
key support and price has a good chance
of bouncing upwards as said before the
more candles the better the probability
the price will respect that pattern
let's go over a short example price
moved to the resistance there are
multiple candles with wicks heading
upwards telling us that price really
doesn't want to move up from here giving
us a good short entry so we enter here
expecting price to reverse from this
point and look what happens it does next
we have the doji candle the doji candle
is a candlestick with a very thin body
and it has wicks on each side why this
one is so important to understand is
because it can be a great indicator on
when the price is about to reverse in a
direction what this candle basically
represents is the market is uncertain on
which way it wants to go and is having
resistance whenever there is uncertainty
or resistance the price will more often
than not head in the opposite direction
let's see an example so here we have
price moving down pretty hard then a
green candle appears and it just so
happens to be a doji candle this is
telling us that sellers are starting to
be less confident and buyers are
starting to enter making this point a
great potential place to enter what i
normally like to do with doji candles is
after i see one i'll wait for two or
more candles the same color to confirm
that the price will reverse so in this
example i see a green doji candle i wait
see two more green candles heading
upwards telling me i can be confident
that the price will continue in that
direction so this is the point where i
enter the trade and boom the price goes
up from here there are multiple
different variations of the doji candle
that you might see there is the regular
one which is the one that we just talked
about in the last example the
long-legged doji candle which is
basically the same candle but just has
larger wicks the dragonfly which has a
small body and a big bottom wick then
the gravestone which has a small body
and has a big upper wick all of these
tell the same exact story a reversal in
price the next candlestick we'll be
looking at is the hammer the hammer is
usually a candle that looks like this a
decent sized body and a long wick what
this candle is telling us is that
sellers got the price all the way down
to here but the buyers absorbed all that
selling pressure and raised the price
all the way back up this is usually an
extremely bullish sign and can tell us
that the market will continue to go in
that direction a candlestick that is
very similar to the hammer is the
shooting star the shooting star is just
like the hammer but it has a small wake
on the opposite side you should be
playing this just like the hammer where
if you see a shooting star candle like
this you can have a good suspicion that
the price will start reversing this next
candlestick pattern is called the
tweezer this pattern is a red
candlestick followed by a green
candlestick both having similar wicks on
the bottom if you see this pair you can
have a pretty good idea this chart is
about to move upwards let's see an
example so here we can see price is
about to hit this support we see a red
candle with a wick on the bottom right
at the support then we see a green
candle that also has a wick heading
downwards this is telling us that the
price is respecting this support and is
now getting some momentum upwards this
would be a great time to buy and look
what happens price raises it's the exact
opposite for a bearish signal so you
want to see a green candlestick then a
red both having wicks at the top we see
that exact pattern here and boom price
falls the last and final candlestick
pattern i want to talk about is the
marabozu the bullish maribozu is going
to be a big green candle without any
wicks so basically just a big green
rectangle the cool thing about this
pattern is that it's a good indicator
that price will keep heading in the same
direction it's going you will usually
see this candle in the middle of a trend
confirming that the trend will keep
moving upwards let's see an example so
here we saw a price reversal price is
starting to head upwards then we see a
bullish maribozu candle notice how the
candle has no upper or lower wicks this
means that the lowest price of this
candle was the exact same as its opening
price and the highest point of this
candle is the exact same as its closing
price this is telling us that buyers
have complete control and we can almost
certainly predict that price will
continue to go upwards and look what
happens it does the bearish maribozu is
the same idea a red candle with no winks
here we see the price had a reversal we
see a bearish maribozu candle telling us
sellers have control and the price will
probably keep moving downwards we enter
making this a winning trade now it's
time to give you a bonus tip for all
those who made it to the end of the
video this is a way of me saying thanks
for watching all the way to the end even
though you should probably try to
memorize these patterns so when you see
them you can have an idea of what the
market is going to do in the back of
your head i completely understand that
it's hard sometimes to look for them or
even remember what they look like well
lucky for you there is a way to make it
so you can have your chart tell you
exactly where a certain type of
candlestick pattern occurs which makes
it really easy for you to spot them and
you don't even necessarily have to
memorize them to do this just go to
trading view click the indicators tab
type in whatever candlestick pattern you
want so for this example we'll do a
bullish engulfing simply click it and
training view will notify you on the
chart when the bullish engulfing candle
appears making it extremely easy to spot
when it happens and you don't even have
to look that hard you can also add
multiple candlestick patterns to your
chart so you can identify when any of
them occur i hope you guys got some
value out of this and you learned
something new if you did i would really
appreciate it if you took five seconds
out of your day and like this video the
one and only problem trading with
candlestick patterns is false breakouts
where a certain candlestick pattern
occurs but the price actually does the
exact opposite of what the pattern
predicts if you want to learn how to
avoid situations like this watch this
video where i go over my secret strategy
to avoid false breakouts thanks for
watching and i'll see you guys
next time
[Music]
you
Browse More Related Video
Every Trading Strategy Explained in 12 Minutes
The ONLY Price Action Trading Strategy you will EVER need (Canβt unsee thisβ¦)
Boot Camp Day 2: Candlesticks
The Strategy I Wish I Knew as a Beginner
Go From a Complete Beginner To a Pro Forex Trader In 11 Minutes Only || Forex Trading For Beginners
Trading Cepat dan Mudah dengan Market Structure (Detail)
5.0 / 5 (0 votes)