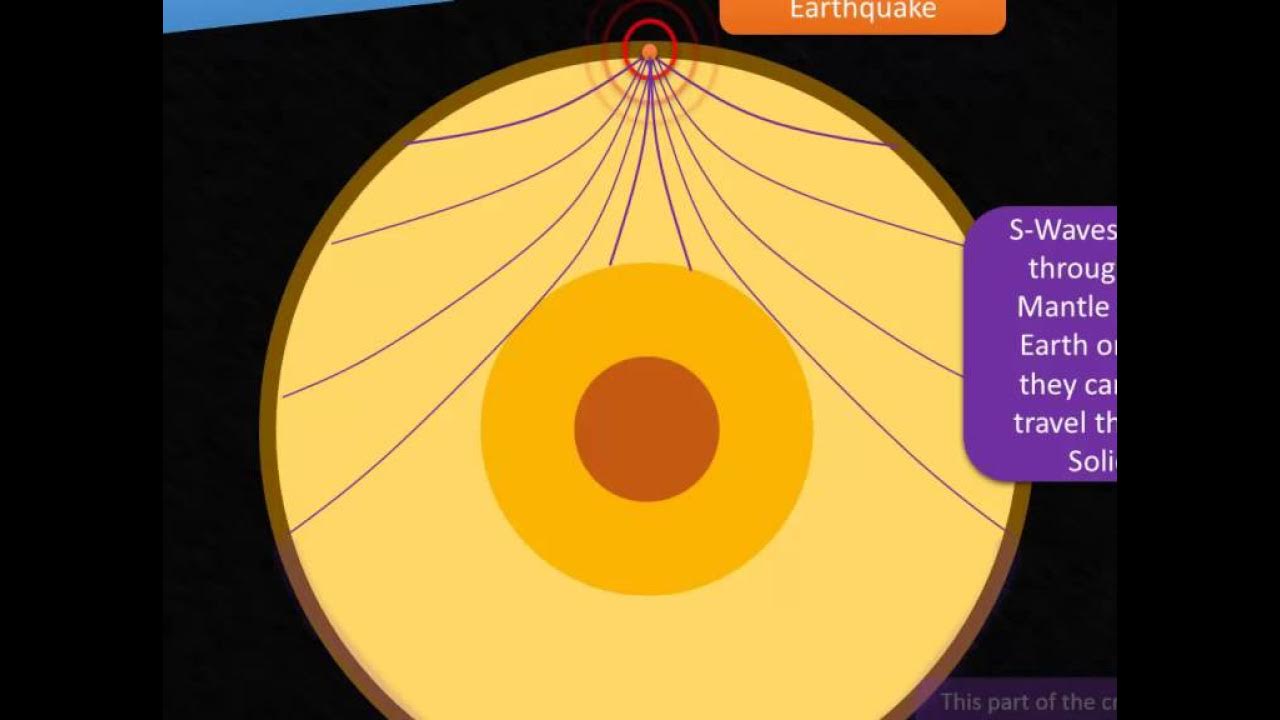
How to locate an epicenter
Summary
TLDRThe video script demonstrates the process of locating an earthquake's epicenter using seismographs. It illustrates the method by identifying the arrival times of P and S waves from a seismograph in Salt Lake City and using a chart to determine the distance from the epicenter, which is found to be 1,800 km away. The script then guides through mapping this distance on a map and intersecting it with circles drawn from other cities to pinpoint the earthquake's location. The technique involves using a compass to draw circles and finding the intersection point, marking the epicenter with an 'X'.
Takeaways
- 📈 The video demonstrates how to locate the epicenter of an earthquake using a seismogram from Salt Lake City.
- 🕒 The arrival time of the P-wave was 1 minute, and the S-wave arrived at 4 minutes, with a 3-minute difference between them.
- 🔍 The difference in arrival times is crucial for determining the distance to the epicenter using a P-wave and S-wave chart.
- 📏 Measuring 3 minutes on the chart corresponds to a distance of 1,800 km from the epicenter.
- 🗺️ A map with a scale is used to measure the distance and draw circles representing the possible earthquake locations.
- 📏 The distance of 1,800 km is measured from Salt Lake City on the map to draw the first circle.
- 🔄 Similar measurements are made from other cities like Savannah and Houston to draw additional circles.
- ⭕️ The intersection of the circles narrows down the possible locations of the earthquake to a few spots.
- 📍 The final step is to find the single point where all the circles intersect, marking the epicenter with an 'X'.
- 👨🏫 The process is taught as a manual method using a compass and map, not a computer-based approach.
- 📝 The demonstration concludes with the identification of the epicenter as the only place with the correct distances from the three cities mentioned.
Q & A
What is the purpose of the example demonstrated in the script?
-The purpose of the example is to illustrate the method of locating an earthquake's epicenter using a seismogram and distance-time graph.
What is a seismogram and why is it used in this context?
-A seismogram is a graphical record of the vibrations caused by an earthquake, and it is used to determine the arrival times of different seismic waves, which helps in locating the epicenter.
What are the P-wave and S-wave, and why are their arrival times significant?
-The P-wave (primary wave) and S-wave (secondary wave) are types of seismic waves that travel through the Earth. Their arrival times are significant because they allow us to calculate the time difference between their arrivals, which is used to estimate the distance to the epicenter.
How is the time difference between the P-wave and S-wave used to estimate the distance to the epicenter?
-The time difference is used in conjunction with a distance-time graph to estimate the distance to the epicenter. The graph provides a scale that relates the time difference to the distance from the seismic source.
What is the time difference between the P-wave and S-wave in the example?
-In the example, the time difference between the P-wave and S-wave is 3 minutes.
How far away is the epicenter from Salt Lake City according to the example?
-According to the example, the epicenter is 1,800 km away from Salt Lake City.
What tool is used to measure the distance on the map in the example?
-A scale is used to measure the distance on the map in the example.
How does the example narrow down the possible locations of the earthquake epicenter?
-The example narrows down the possible locations by drawing circles with radii equal to the estimated distances from multiple cities and finding the intersection points of these circles.
What is the method of using a compass to draw a circle on a map as mentioned in the script?
-The method involves placing one point of the compass at the zero mark and the other point at the distance from the city, then drawing a circle with that radius to indicate the possible epicenter locations.
What is the final step in locating the epicenter according to the script?
-The final step is to mark the intersection point of the circles with an 'X' to indicate the epicenter's location.
Why is it important to use multiple cities' data to locate the epicenter?
-Using multiple cities' data helps to increase the accuracy of the epicenter location by providing multiple points of reference and reducing the area of uncertainty.
Outlines

This section is available to paid users only. Please upgrade to access this part.
Upgrade NowMindmap

This section is available to paid users only. Please upgrade to access this part.
Upgrade NowKeywords

This section is available to paid users only. Please upgrade to access this part.
Upgrade NowHighlights

This section is available to paid users only. Please upgrade to access this part.
Upgrade NowTranscripts

This section is available to paid users only. Please upgrade to access this part.
Upgrade NowBrowse More Related Video
5.0 / 5 (0 votes)


