Goodness of Maximum Likelihood Estimator for linear regression
Summary
TLDRThe script delves into the concept of linear regression, discussing both the optimal solution and the probabilistic perspective. It highlights the equivalence of the maximum likelihood estimator to the solution derived from linear regression under the assumption of Gaussian noise. The focus then shifts to evaluating the estimator's performance, introducing the idea of expected deviation between the estimated and true parameters. The script concludes by emphasizing the impact of noise variance and feature relationships on the estimator's quality, inviting further exploration into improving the estimator's accuracy.
Takeaways
- 📚 The script discusses the problem of linear regression and the derivation of the optimal solution W*.
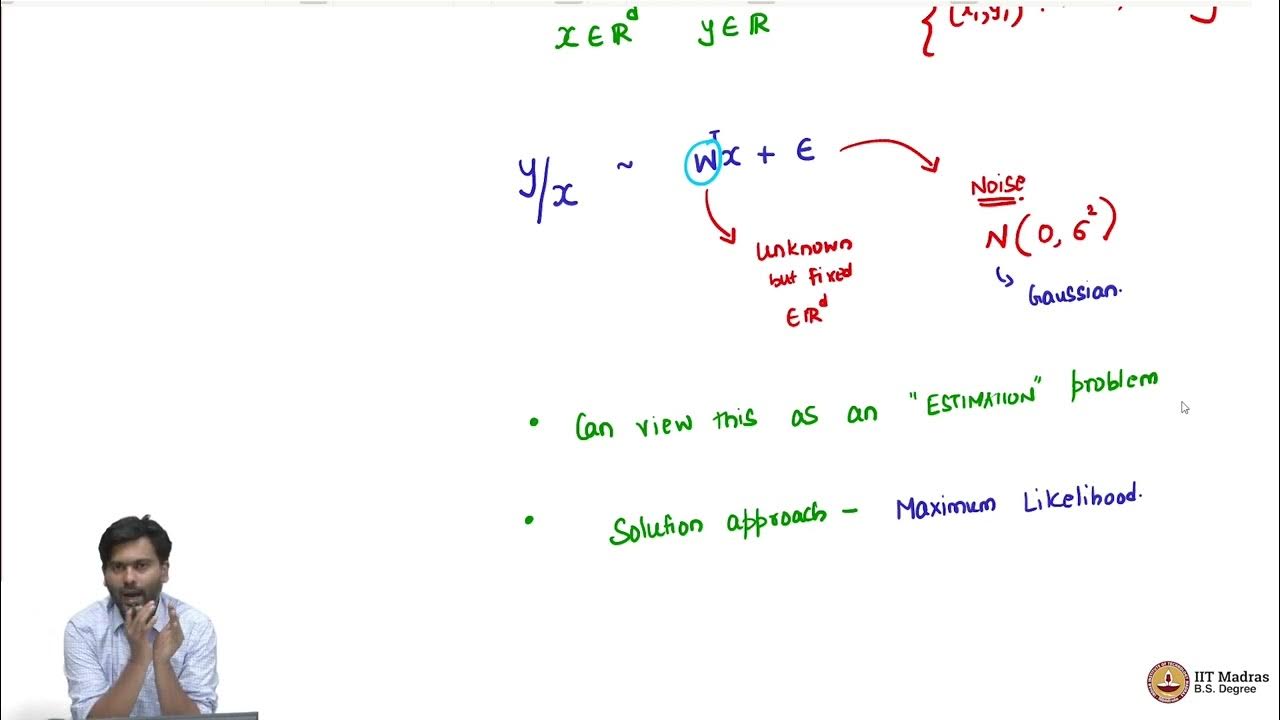
- 🧩 It explains the probabilistic viewpoint of linear regression, where y given x is a result of W transpose x plus Gaussian noise.
- 🔍 The script highlights that the W* from linear regression is the same as the maximum likelihood estimator for W, denoted as ŴML.
- 🤖 The maximum likelihood estimator ŴML is shown to be equivalent to assuming a squared error in the noise, which is a Gaussian assumption.
- 🔑 The script introduces the concept of using the estimator ŴML to understand its properties and gain insights into the problem.
- 📉 The importance of estimating the true W is emphasized, and the script discusses how to measure the 'goodness' of ŴML as an estimator.
- 📊 The script explains that ŴML is a random variable due to the randomness in y, and thus its estimation quality can vary.
- 📈 The concept of expected value is used to understand the average performance of ŴML in estimating W, considering the randomness in y.
- 📐 The script introduces the Euclidean norm squared as a measure to quantify the deviation between the estimated ŴML and the true W.
- 📘 It is mentioned that the average deviation of ŴML from the true W is proportional to the variance of the noise (sigma squared) and the trace of the inverse of the covariance matrix of the features.
- 🔄 The script suggests that while we cannot change the noise variance, we might be able to improve the estimator by considering the relationship between features.
Q & A
What is the problem of linear regression discussed in the script?
-The script discusses the problem of linear regression, focusing on deriving the optimal solution W* for the model and exploring the probabilistic viewpoint of linear regression where y given x is modeled as W transpose x plus noise.
What is the relationship between W* from linear regression and ŴML from maximum likelihood estimation?
-The script explains that W* derived from linear regression is exactly the same as ŴML, which is derived from the maximum likelihood estimation, given the assumption of Gaussian noise.
Why is it beneficial to view the linear regression problem from a probabilistic perspective?
-Viewing linear regression from a probabilistic perspective allows for the derivation of the maximum likelihood estimator for W, which provides insights into the properties of the estimator and helps in understanding the problem itself.
What does the script suggest about the properties of the maximum likelihood estimator ŴML?
-The script suggests that ŴML has nice properties that can provide insights into extending the linear regression problem, particularly in terms of how good it is as an estimator for the true W.
What is the significance of assuming Gaussian noise in the linear regression model?
-Assuming Gaussian noise is equivalent to assuming that the error is squared error, which simplifies the derivation of the maximum likelihood estimator and leads to the same solution as the optimal solution from linear regression.
How is the quality of the estimator ŴML measured in the script?
-The quality of ŴML is measured by looking at the expected value of the norm squared difference between ŴML and the true W, which is derived from considering the randomness in y.
What does the script imply about the randomness of y and its impact on ŴML?
-The script implies that since y is a random variable, ŴML, which is derived from y, is also random. This randomness affects the quality of ŴML as an estimator for the true W.
What is the expected value of the norm squared difference between ŴML and the true W?
-The expected value of the norm squared difference is given by sigma squared times the trace of the matrix (XX^T) pseudo-inverse or inverse, indicating the average deviation of ŴML from the true W.
How does the variance of the Gaussian noise (sigma squared) affect the quality of ŴML?
-The variance of the Gaussian noise directly affects the quality of ŴML, as a larger variance means more noise is added to W transpose X, leading to a larger average deviation between ŴML and the true W.
What role do the features in the data play in the quality of ŴML?
-The features in the data, represented by the trace of the matrix (XX^T) inverse, also affect the quality of ŴML. The relationship between the features influences the estimator's goodness.
Can the quality of ŴML be improved by manipulating the features in the data?
-The script suggests that while we cannot change the variance of the noise (sigma squared), we might be able to improve the quality of ŴML by manipulating the features in the data, although it does not specify how this can be achieved.
Outlines

This section is available to paid users only. Please upgrade to access this part.
Upgrade NowMindmap

This section is available to paid users only. Please upgrade to access this part.
Upgrade NowKeywords

This section is available to paid users only. Please upgrade to access this part.
Upgrade NowHighlights

This section is available to paid users only. Please upgrade to access this part.
Upgrade NowTranscripts

This section is available to paid users only. Please upgrade to access this part.
Upgrade NowBrowse More Related Video

Probabilistic view of linear regression

Relation between solution of linear regression and ridge regression

10.3 Probabilistic Principal Component Analysis (UvA - Machine Learning 1 - 2020)

Week 6 Statistika Industri II - Analisis Regresi (part 1)

Dasar Analisis Regresi: Apa itu regresi dan jenis-jenis regresi

Ridge regression
5.0 / 5 (0 votes)