1. Candlesticks Charts
Summary
TLDRThis tutorial video introduces candlestick charts for technical analysis. It covers candlestick anatomy, coloring, patterns, timeframes and key tips. The host stresses candlesticks show probability, not certainty. He advises studying a few key patterns in trending markets, using higher timeframes to zoom out from noise, marking swing points and letting candles close before acting.
Takeaways
- 😀 Technical analysis is a tool to make probabilistic forecasts of future price behavior based on price history
- 👍 Candlestick charts visually show if closing price was higher or lower than the opening price
- 🔎 The candlestick OHLC data shows precise open, high, low and close prices within a time frame
- ⏱ Higher timeframe candles comprise lower timeframe candles, so pay attention to closes
- 📈 Beginners should focus on a couple higher timeframes to avoid noise and overtrading
- 😯 Wait for candlestick patterns to occur in the right context, like reversals in a trend
- ✅ Use higher timeframes and zoom out to avoid getting caught up in lower timeframe noise
- 👀 Spend time studying charts until reading candlesticks becomes second nature
- 🤔 Candlestick patterns alone won't make you money - consider context and nuance
- 🧠 Technical analysis helps manage risk and define possible entries, not guarantee outcomes
Q & A
What is the overall premise of technical analysis according to the speaker?
-The speaker states that technical analysis is a tool to make probabilistic forecasts of future price behavior based on price history. It is about working with probabilities and odds to get favorable risk-rewards, not deriving absolute knowledge or facts about the future.
What are the three main components that make up candlestick anatomy?
-The three main components are: 1) Candlestick color (red/bearish vs green/bullish), 2) The candle body (open vs close prices), and 3) The wicks (highest and lowest price points within the time frame).
How does time frame context relate to reading candlestick open/high/low/close data?
-The time frame dictates what period of time each candle covers. So on an hourly chart, the open/high/low/close data refers to price behavior within each 1-hour period. This gives context to key levels marked on the chart.
Why should traders wait for candlestick closes before making conclusions?
-A candlestick's shape can change dramatically between its open and close. So it's important to wait for the close before making trading decisions, especially on higher time frames where candles represent longer periods of time.
What common beginner mistakes does the speaker warn about regarding candlestick patterns?
-Taking trades based solely on candle patterns without considering context or time frames. Also obsessively hunting for patterns everywhere without appreciating if reversal signals make sense based on the preceding trend.
What time frame combination does the speaker recommend for beginners?
-The speaker recommends focusing on the daily and hourly time frames when starting out. This provides a helpful balance without getting caught up in lower timeframe noise.
Why should new traders zoom out from lower timeframes?
-Zooming out provides context and ensures new traders don't get myopically focused on lower timeframe "noise". It prevents overtrading and supports better decision making.
What makes candle patterns most useful?
-Candlestick patterns become most useful when they appear within strong, discernable trends at areas like tops and bottoms. This provides reversal context that can suggest good trade location and timing.
Where can additional candlestick patterns be found?
-The speaker provides a link in the description to an image with a more comprehensive list of candlestick patterns beyond the ones covered in this video.
What final tips does the speaker offer regarding best practices with candlestick analysis?
-Use higher timeframes, zoom out to see the bigger picture, find a few candle patterns that work well (don't obsess over all patterns), and wait for ideal pattern contexts based on preceding trends.
Outlines

This section is available to paid users only. Please upgrade to access this part.
Upgrade NowMindmap

This section is available to paid users only. Please upgrade to access this part.
Upgrade NowKeywords

This section is available to paid users only. Please upgrade to access this part.
Upgrade NowHighlights

This section is available to paid users only. Please upgrade to access this part.
Upgrade NowTranscripts

This section is available to paid users only. Please upgrade to access this part.
Upgrade NowBrowse More Related Video

Technical Analysis For Beginners: Candlestick Trading Guide!
Types of Charts Used in Technical Analysis

Candlestick Patterns Analysis: What is Candlestick, How to read Candlestick chart | CA Nishant Kumar

Jenis-jenis Chart Saham untuk Trading | feat. Michael Yeoh

الدرس ٥: أسهل طريقة لقراءة الشموع اليابانية
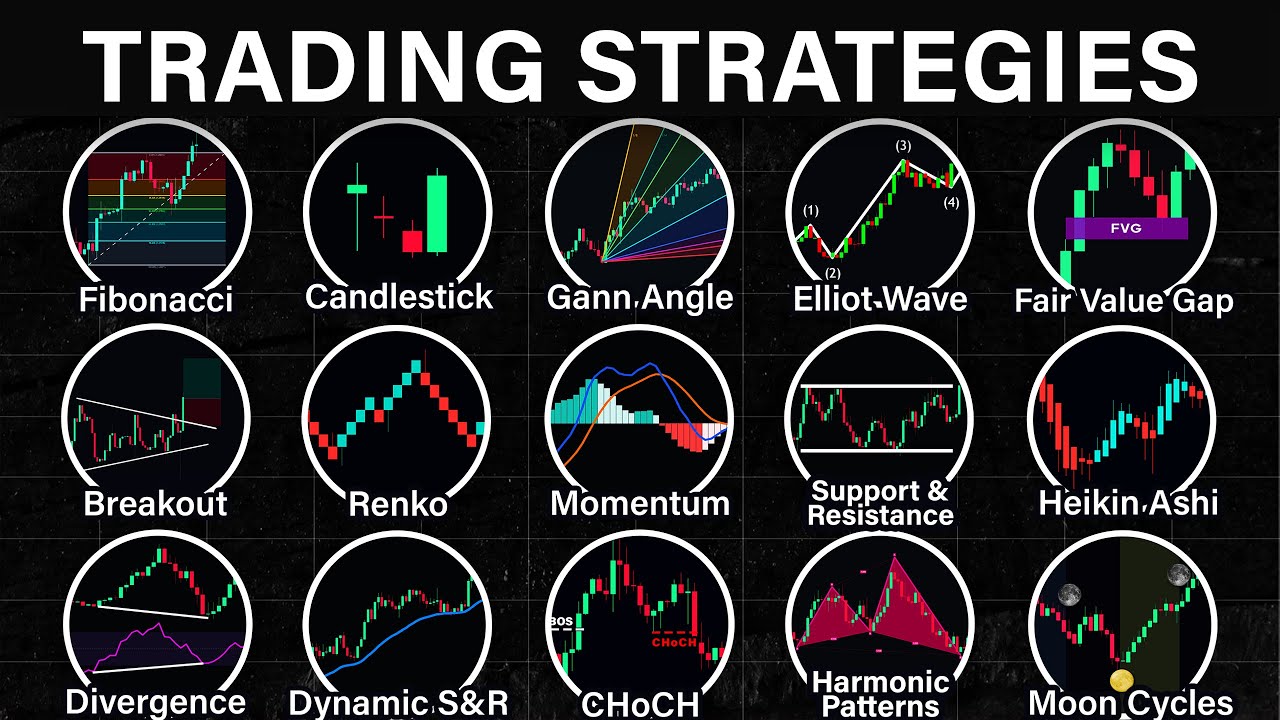
Every Trading Strategy Explained in 12 Minutes
5.0 / 5 (0 votes)