StatQuest: K-means clustering
Summary
TLDRIn this episode of Stat Quest, Josh Starmer introduces k-means clustering, a method for organizing data points into distinct groups. The tutorial covers selecting the number of clusters (K), randomly choosing initial points, calculating distances to assign points to the nearest cluster, and iteratively updating cluster means until convergence. It also explores determining the optimal K value using an 'elbow plot' and discusses the difference between k-means and hierarchical clustering. The video concludes with examples of applying k-means to data on a number line, in two dimensions, and on a heatmap, illustrating the versatility of this clustering technique.
Takeaways
- 📚 The video is an educational tutorial on k-means clustering, a method used to group data points into clusters.
- 🔍 It explains how to identify the optimal number of clusters, 'K', for the data set, which is a crucial step in k-means clustering.
- 🎯 The process begins by randomly selecting 'K' distinct data points as initial clusters and then iteratively refining these clusters.
- 📏 The script describes how to calculate the distance of each data point from the centroids of the clusters to assign them to the nearest cluster.
- ⚖️ It discusses the importance of calculating the mean of each cluster to update the centroids and reassign points based on these new values.
- 🔄 The iterative process continues until the clusters no longer change, indicating that the clustering has converged to a stable solution.
- 📊 The quality of clustering can be assessed by measuring the total variation within each cluster, with lower variation indicating better clustering.
- 📈 The 'elbow method' is introduced as a way to determine the best value for 'K' by observing the point where the reduction in variance per additional cluster diminishes.
- 🤖 The video highlights that k-means clustering is different from hierarchical clustering in that it aims to partition data into a specified number of clusters.
- 📈 The script also covers how to apply k-means clustering to data that is not on a number line, using Euclidean distance in two or more dimensions.
- 🌡️ It mentions that k-means can be used with data represented as a heatmap, by treating the data points in a two-dimensional space and applying the same clustering principles.
- 🎶 The video ends with a call to action for viewers to subscribe for more content and support the channel by liking the video and considering purchasing the creator's songs.
Q & A
What is the main topic of the video?
-The main topic of the video is k-means clustering, a method used to group data into clusters based on their similarities.
Who is the presenter of the video?
-The presenter of the video is Josh Stormer.
What is the purpose of using k-means clustering in the video?
-The purpose of using k-means clustering in the video is to identify clusters in data without relying on visual inspection, such as distinguishing between different types of tumors or cell types.
What is the 'K' in k-means clustering?
-The 'K' in k-means clustering represents the number of clusters that the algorithm is instructed to identify in the data.
How does k-means clustering start the clustering process?
-K-means clustering starts by randomly selecting 'K' distinct data points as the initial clusters.
What is the method used to assign data points to clusters in k-means clustering?
-Data points are assigned to the nearest cluster based on the calculated distance between the point and the centroids of the clusters.
How does the k-means algorithm determine the best value for K?
-The best value for K can be determined by trying different values and observing the total variation within the clusters, often using an elbow plot to identify the point where the reduction in variance decreases significantly.
What is an elbow plot in the context of k-means clustering?
-An elbow plot is a graphical representation that shows the reduction in variance as the number of clusters increases, helping to identify the optimal number of clusters by finding the 'elbow' point where the decrease in variance slows down.
How does k-means clustering differ from hierarchical clustering?
-K-means clustering aims to partition the data into a specified number of clusters, whereas hierarchical clustering builds a tree of clusters and does not require a predetermined number of clusters.
Can k-means clustering be applied to data that is not plotted on a number line?
-Yes, k-means clustering can be applied to data in two or more dimensions using the Euclidean distance to measure the distance between points.
How is the Euclidean distance calculated for data with more than two dimensions?
-The Euclidean distance for data with more than two dimensions is calculated as the square root of the sum of the squared differences between corresponding coordinates of points in the multidimensional space.
What is the significance of calculating the mean of each cluster in k-means clustering?
-Calculating the mean of each cluster is important because it helps to reassign the data points to the nearest updated cluster center, which is essential for the iterative process of refining the clusters.
Outlines

This section is available to paid users only. Please upgrade to access this part.
Upgrade NowMindmap

This section is available to paid users only. Please upgrade to access this part.
Upgrade NowKeywords

This section is available to paid users only. Please upgrade to access this part.
Upgrade NowHighlights

This section is available to paid users only. Please upgrade to access this part.
Upgrade NowTranscripts

This section is available to paid users only. Please upgrade to access this part.
Upgrade Now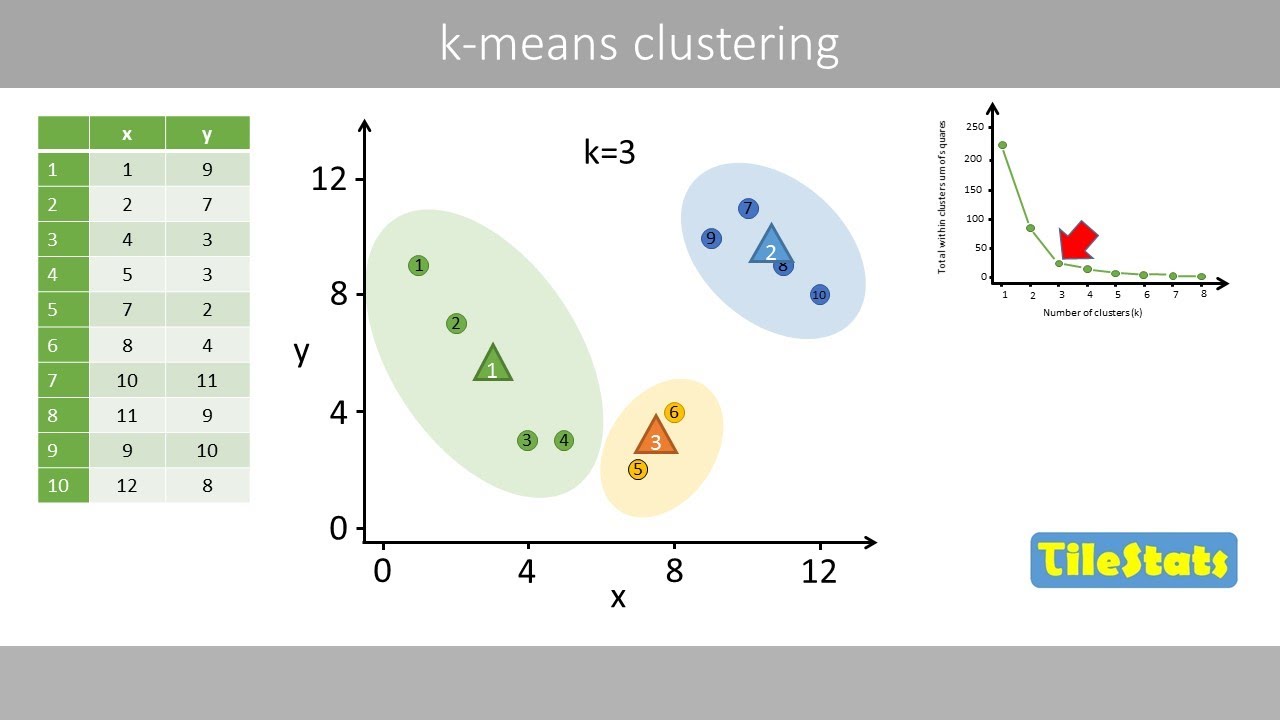


5.0 / 5 (0 votes)