Energy Storage Excel Financial Model

Oak Business Consultant
1 Feb 202303:38

Summary

TLDRDog Business Consultants present an energy storage Excel financial model designed for energy storage businesses. The model includes an input sheet for assumptions, a revenue analysis, financial statements, a dashboard, and various financial schedules such as depreciation, loan amortization, and a startup summary. It also features monthly profit and loss statements, cash flow statements, break-even analysis, project evaluation, sensitivity analysis, and key performance indicators (KPIs). The model aims to provide a comprehensive visual and analytical representation of the financial performance of energy storage businesses.

Takeaways

  • πŸ“Š Dog Business Consultants introduce a new energy storage financial model in Excel, designed for energy storage businesses.
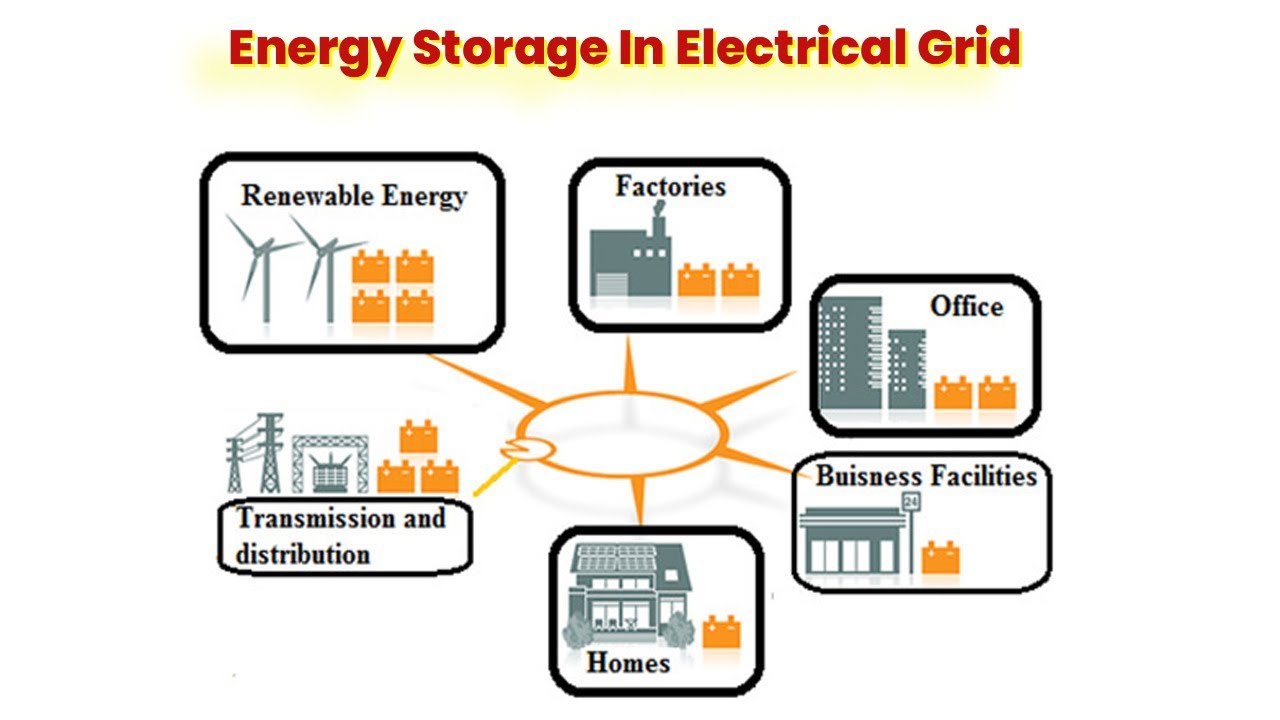
  • ⚑ Energy is purchased, stored based on demand and capacity, then sold to consumers.
  • πŸ“‹ The table of contents includes input sheet, revenue analysis, financial statements, and a dashboard for visual representation of financial performance.
  • πŸ“ The input sheet covers assumptions for capital structure, cost and price of revenue streams, monthly payroll, operating expenses, capital expenditure, and receivable/payable days.
  • πŸ’‘ The revenue analysis sheet includes available capacity in kilowatt-hours, usable energy transmission per month, revenue from each stream, and total cost of services.
  • πŸ“‰ The depreciation and loan amortization schedule details asset value reduction over five years and monthly principal and interest payments.
  • πŸ’Ό The startup summary estimates first-year investment needs, with a graphical representation of total cost and fund utilization.
  • πŸ“ˆ The monthly profit and loss statement outlines revenue, cost of services, operating expenses, and net income before and after taxes.
  • πŸ’΅ The cash flow statement shows net cash flows from operating, investing, and financing activities, along with a working capital table for account receivable and payable amounts.
  • βš–οΈ The statement of financial position details assets, equity, and liabilities for the year ended, while the break-even analysis indicates the point where costs and income are equal.
  • πŸ“Š The project evaluation includes company valuation at year 0, fundroid analysis, and minimum investment required.
  • πŸ” The sensitivity analysis compares company valuation in actual, optimistic, and worst-case scenarios.
  • πŸ“Š The KPIs and ratios cover profitability, liquidity, solvency, and efficiency, with graphical illustrations.
  • πŸ“Š The dashboard displays key financial metrics and graphical representations for better understanding of performance measures.

Q & A

  • What is the main purpose of the energy storage Excel financial model?

    -The main purpose of the energy storage Excel financial model is to help energy storage businesses manage and analyze their financial performance by purchasing, storing, and selling energy according to demand and storage capacity.

  • What are the key components included in the table of contents of the financial model?

    -The key components included in the table of contents are the input sheet, revenue analysis, financial statements, and a dashboard for visual representation of financial performance.

  • What assumptions are covered in the input sheet?

    -The input sheet covers assumptions for the capital structure, cost and price of revenue streams, monthly payroll, operating expenses, capital expenditure, and receivable and payable days.

  • What information does the revenue analysis sheet provide?

    -The revenue analysis sheet provides information on available capacity in kilowatt hours, usable energy transmission per month, revenue from each stream, and the total cost of services.

  • What is included in the depreciation and loan amortization schedule?

    -The depreciation and loan amortization schedule includes the reduction in the value of assets over five years and the monthly principal and interest payments.

  • What does the startup summary estimate?

    -The startup summary estimates the required investment in the first year of the business and provides a graphical representation of total cost and utilization of funds.

  • What details are shown in the monthly profit and loss statement?

    -The monthly profit and loss statement includes details about revenue, cost of services, operating expenses, and net income before and after taxes.

  • What information is provided in the cash flow statement?

    -The cash flow statement shows the net cash flows from operating activities, investing activities, and financing activities.

  • What does the working capital table display?

    -The working capital table displays the amounts in accounts receivable and payable and the changes in these accounts.

  • What does the break-even analysis determine?

    -The break-even analysis determines the point at which the costs and income of the business are equal, shown with respect to sales amount and kilowatt hours of energy used, along with a graphical representation.

  • What is the purpose of the project evaluation section?

    -The project evaluation section shows the value of the company at year 0, includes fundroid analysis, and determines the minimum investment required.

  • What scenarios are compared in the sensitivity analysis?

    -The sensitivity analysis compares the valuation of the company in actual, optimistic, and worst-case scenarios.

  • What financial ratios are included in the KPIs and ratios section?

    -The KPIs and ratios section includes profitability, liquidity, solvency, and efficiency ratios with their graphical illustrations.

  • What is the function of the dashboard in the financial model?

    -The dashboard provides the most relevant financial graphical representations of the model, depicting key financial metrics for better understanding of performance measures.

Outlines

00:00

πŸ”‹ Energy Storage Financial Model Overview

This paragraph introduces an Excel financial model tailored for energy storage businesses. It covers the process of purchasing and storing energy, followed by selling it to consumers. The model includes various sections such as a table of contents, input sheets for capital structure, cost, price, revenue streams, monthly payroll, operating expenses, capital expenditure, and receivables and payables. Additionally, it features revenue analysis, depreciation and loan amortization schedules, startup summaries, monthly profit and loss statements, cash flow statements, working capital tables, statements of financial position, break-even analyses, project evaluations, sensitivity analyses, and key performance indicators (KPIs) and ratios. The model concludes with a dashboard for visual representation of key financial metrics.

Mindmap

Keywords

πŸ’‘Energy Storage

Energy storage refers to the capture of energy produced at one time for use at a later time. In the context of the video, it is the central business model, where energy is purchased, stored, and then sold to consumers as per demand and storage capacity.

πŸ’‘Input Sheet

The input sheet is a section of the financial model where various assumptions and initial data are entered. This includes capital structure, costs, prices, monthly payroll, operating expenses, capital expenditure, and receivable and payable days. It serves as the foundational data for generating the financial projections and analysis.

πŸ’‘Revenue Analysis

Revenue analysis involves examining the income generated from different streams within the energy storage business. The video mentions analyzing available capacity in kilowatt hours, usable energy transmission per month, and total cost of services, which are crucial for understanding the business's financial performance.

πŸ’‘Depreciation

Depreciation is the reduction in the value of an asset over time. In the financial model, depreciation schedules are included to show this reduction over the next five years, affecting the overall financial health and tax calculations of the business.

πŸ’‘Loan Amortization

Loan amortization refers to the process of paying off a debt over time in regular installments of principal and interest. The model includes a loan amortization schedule that shows these monthly payments, helping in understanding the cash outflows related to financing.

πŸ’‘Startup Summary

The startup summary provides an estimation of the initial investment required in the first year of the business. It includes a graphical representation of the total costs and how the funds will be utilized, essential for planning and securing investments.

πŸ’‘Profit and Loss Statement

A profit and loss statement summarizes the revenues, costs, and expenses incurred during a specific period. In the video, this statement shows revenue, cost of services, operating expenses, and net income before and after taxes, offering a snapshot of the business's profitability.

πŸ’‘Cash Flow Statement

The cash flow statement displays the net cash flows from operating, investing, and financing activities. It provides insights into how cash is being generated and used, which is crucial for assessing the liquidity and financial stability of the energy storage business.

πŸ’‘Break-Even Analysis

Break-even analysis determines the point at which total revenues equal total costs, meaning no profit or loss. The model shows the break-even point in terms of sales amount and kilowatt hours of energy used, which helps in understanding the minimum performance needed to avoid losses.

πŸ’‘Sensitivity Analysis

Sensitivity analysis evaluates how different values of an independent variable affect a particular dependent variable under a given set of assumptions. In the video, it compares the company's valuation under actual, optimistic, and worst-case scenarios, providing a range of potential outcomes.

πŸ’‘KPIs and Ratios

KPIs (Key Performance Indicators) and ratios are metrics used to assess various aspects of business performance, such as profitability, liquidity, solvency, and efficiency. The financial model includes these metrics with graphical illustrations to help in understanding the business's health and operational effectiveness.

Highlights

Introduction of an energy storage Excel financial model designed for businesses in the energy storage sector.

The model covers the process from purchasing energy, storing it, and then selling it to consumers.

Includes a comprehensive table of contents for easy navigation through the financial model.

Input sheets for assumptions on capital structure, cost, price, revenue streams, payroll, operating expenses, capital expenditure, and receivable and payable days.

Revenue analysis sheet detailing available capacity, usable energy transmission, revenue streams, and total cost of services.

Depreciation and loan amortization schedule for the next five years.

Startup summary estimating initial investment requirements and graphical representation of total cost and utilization of funds.

Monthly profit and launch statement including revenue, cost of services, operating expenses, and net income before and after taxes.

Cash flow statement showing net cash flows from operating, investing, and financing activities.

Working capital table displaying account receivable and payable amounts and changes.

Statement of financial position listing rural assets, equity, and liabilities for the year ended.

Break-even analysis indicating the point where business costs and income are equal, with graphical representation.

Project evaluation showing the value of the company at year 0, fundroid analysis, and minimum investment required.

Sensitivity analysis comparing company valuation in actual, optimistic, and worst-case scenarios.

KPIs and ratios section detailing profitability, liquidity, solvency, and efficiency with graphical illustrations.

Dashboard providing a graphical representation of key financial metrics for better understanding of performance measures.

Thanks for watching, summarizing the end of the presentation.

Transcripts

play00:00

dog Business Consultants are back with

play00:02

another financial model which is energy

play00:04

storage Excel financial model this model

play00:08

is designed for energy storage

play00:09

businesses First Energy is purchased and

play00:13

stored as per the demand and the storage

play00:15

capacity then further it is sold to the

play00:18

consumers

play00:20

starting with the table of content that

play00:22

includes the input sheet Revenue

play00:24

analysis financial statements as a

play00:27

dashboard for the visual representation

play00:28

of your financial performance

play00:31

next we have the input sheet

play00:34

reading which includes the assumptions

play00:36

for the capital structure the cost and

play00:39

the price

play00:40

of the revenue streams

play00:42

monthly payroll operating expenses

play00:45

capital expenditure

play00:47

and the receivable and payable days

play00:51

next we have the revenue analysis sheet

play00:53

which includes the available capacity in

play00:56

kilowatt hours the usable energy

play00:58

transmission per month it includes the

play01:01

revenue from each stream and the total

play01:03

cost of services

play01:06

next we have the depreciation and loan

play01:08

amortization schedule

play01:11

depreciation is a reduction in the value

play01:13

of your assets for the next five years

play01:15

and the loan amortization schedule shows

play01:18

the monthly principal and interest

play01:20

payments

play01:24

moving on to the startup summary the

play01:26

startup summary is the estimation of how

play01:28

much investment is required in the first

play01:30

year of your business and it also

play01:32

consists the graphical representation of

play01:34

total cost and utilization of funds

play01:40

now we have the monthly profit and

play01:43

launch statement it mentions about

play01:45

Revenue the cost of services operating

play01:48

expenses and net income before and after

play01:51

taxes

play01:55

next we have the cash flow statement

play01:57

that shows the net cash flows from

play01:59

operating activities investing

play02:01

activities and financing activities

play02:05

the working capital table shows the

play02:07

amount in account receivable and payable

play02:09

and the change in these accounts

play02:14

moving on to the statement of financial

play02:16

position which shows rural assets equity

play02:18

and liabilities for the year ended

play02:24

next we have the break-even analysis

play02:26

that is a point at which the cause and

play02:28

income of your business are equal the

play02:30

model shows the break even with respect

play02:33

to the sales amount as well as the

play02:35

kilowatt hours energy used

play02:38

it also shows the graphical

play02:39

representation of the break even

play02:43

moving on to the project evaluation

play02:46

it shows the value of your company at

play02:49

year 0. it also includes the fundroid

play02:52

analysis and minimum investment required

play02:57

next we have

play02:59

the sensitivity analysis it is the

play03:01

comparison of valuation of the company

play03:03

in the actual optimistic and worst case

play03:06

scenarios

play03:09

moving on to the kpis and ratios

play03:13

this financial rati shows includes the

play03:15

profitability liquidity solvency and

play03:18

efficiency row shows

play03:19

with their graphical illustration

play03:26

in the last we have the dashboard which

play03:28

shows the most relevant Financial

play03:29

graphical representation of the model

play03:30

and depicts the key financial metrics

play03:33

for the better understanding of the

play03:35

performance measures

play03:36

thanks for watching

Rate This
β˜…
β˜…
β˜…
β˜…
β˜…

5.0 / 5 (0 votes)

Related Tags
Energy StorageFinancial ModelExcel ModelBusiness ConsultantsRevenue AnalysisDepreciationLoan AmortizationStartup SummaryCash FlowBreak-Even AnalysisProject EvaluationSensitivity AnalysisKPIsRatiosDashboard