🌍 Mapping Mangrove Forest Loss (2017–2023) Using Sentinel-2 & Google Earth Engine 🌱 | Full GEE
Summary
TLDRIn this tutorial, learn how to monitor mangrove forest dynamics from 2017 to 2023 using Google Earth Engine and Sentinel-2 imagery. The video covers key steps such as defining the area of interest, processing satellite data, and applying machine learning for mangrove classification. It demonstrates how to handle cloudy scenes, create an annual time series, and visualize changes in mangrove cover. By the end, you'll have built a robust monitoring tool to detect ecosystem changes, with free satellite data and machine learning techniques. The video concludes with a call to action to explore other ecosystems for monitoring.
Takeaways
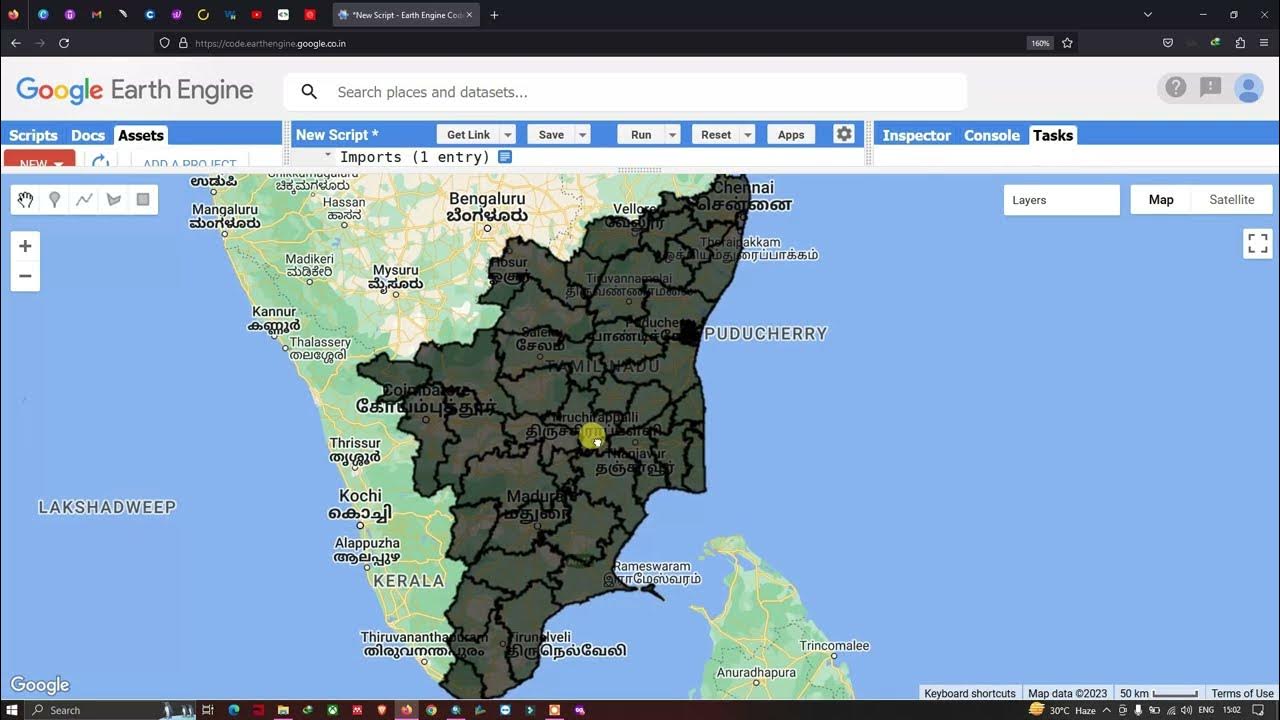
- 😀 Define the Area of Interest (AOI) in the coastal region of South Africa, where mangroves are located.
- 🌍 Use Sentinel 2 surface reflectance data from 2022 to monitor mangrove dynamics and filter out cloudy scenes.
- 📊 Compute two key indices—NDVI (Normalized Difference Vegetation Index) and NDWI (Normalized Difference Water Index)—to highlight vegetation and water content.
- 💻 Combine these indices with spectral bands to prepare a composite image for mangrove classification.
- 🌱 Train a random forest classifier to detect mangrove cover using the composite image data.
- 🌟 Apply the trained model to satellite images from 2017 to 2023 to classify mangrove cover for each year.
- 📅 Handle missing or cloudy years by setting their mangrove pixel count to zero, ensuring more robust results.
- 📈 Generate a yearly time series of mangrove cover from 2017 to 2023 to track ecosystem changes over time.
- 📉 Visualize the yearly trend in mangrove cover, highlighting areas of gain or loss with a clear green line.
- 🗺️ Display the most recent 2022 mangrove classification map, with green indicating mangrove areas and red indicating non-mangrove areas.
- 🎥 Build a free, cloud-based mangrove change monitoring tool using satellite data and machine learning to observe ecosystem trends.
Q & A
What is the main objective of the video?
-The main objective of the video is to demonstrate how to monitor coastal ecosystem changes, specifically focusing on mangrove forest dynamics, using satellite data from Google Earth Engine and Sentinel 2 imagery from 2017 to 2023.
Which region is being focused on for monitoring mangrove cover?
-The video focuses on a coastal region in South Africa where mangroves are present.
What satellite data is being used for the analysis?
-Sentinel 2 surface reflectance data is being used for the analysis, along with Google Earth Engine for processing.
Why is cloud coverage important in satellite imagery processing?
-Cloudy scenes are filtered out to ensure the satellite imagery is accurate and not obscured by cloud cover, which could affect the classification and analysis of mangrove cover.
What two key indices are computed from the Sentinel 2 data?
-The two key indices computed are NDVI (Normalized Difference Vegetation Index) and NDWI (Normalized Difference Water Index), which are essential for analyzing vegetation and water bodies.
How is the satellite data prepared for classification?
-The data is prepared by combining key spectral bands and indices (NDVI and NDWI) to create a composite image that is ready for classification.
What machine learning technique is used to detect mangrove cover?
-A random forest classifier is used to detect mangrove cover by training the model on labeled data and then applying it to the satellite imagery.
How does the model handle missing or cloudy data?
-The model handles missing or cloudy years by setting their mangrove pixel count to zero, which improves the robustness of the analysis over time.
What type of visualization is used to show the trend in mangrove cover?
-The yearly trend in mangrove cover is visualized using a chart, with a green line representing the mangrove coverage trend from 2017 to 2023.
What does the final map for 2022 display?
-The final map for 2022 displays classified areas where green indicates mangrove cover and red represents non-mangrove areas.
Outlines

This section is available to paid users only. Please upgrade to access this part.
Upgrade NowMindmap

This section is available to paid users only. Please upgrade to access this part.
Upgrade NowKeywords

This section is available to paid users only. Please upgrade to access this part.
Upgrade NowHighlights

This section is available to paid users only. Please upgrade to access this part.
Upgrade NowTranscripts

This section is available to paid users only. Please upgrade to access this part.
Upgrade NowBrowse More Related Video

Water Quality Monitoring using Remote sensing techniques GEE web Application || GEE Web Application
Importing GIS shapefiles into Google Earth Engine

GEE | Google Earth Engine Pengenalan Dasar, Tool dan Memanggil Citra

OSINT At Home #9 – Top 4 Free Satellite Imagery Sources
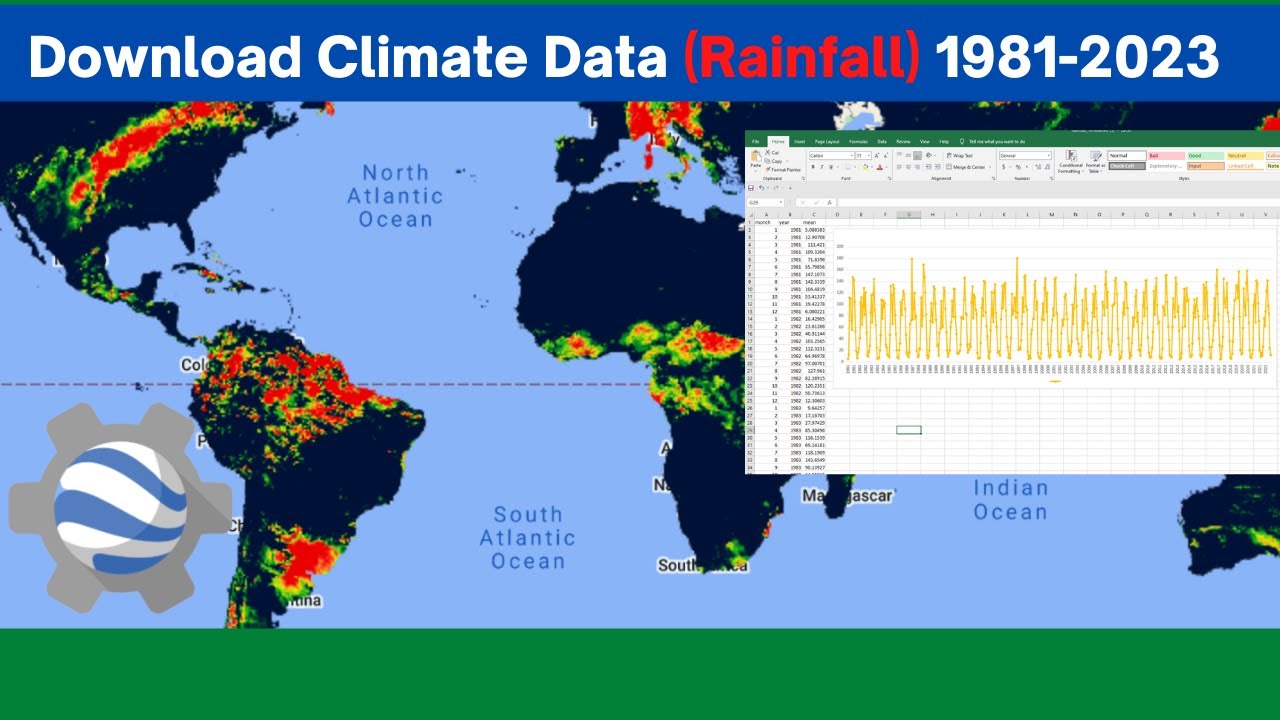
Download Climate Data (Rainfall) from 1981 - 2022 using Earth Engine API

Google Earth Engine Tutorial - GEE sign in 2min:
5.0 / 5 (0 votes)