Fungsi Kuadrat (Part 1)
Summary
TLDRThis video covers quadratic functions, explaining the difference between quadratic equations and functions. It introduces the general form of quadratic functions (y = ax² + bx + c or f(x) = ax² + bx + c), highlights key concepts like the graph’s parabolic shape, and discusses the effects of the coefficient 'a' on the graph's orientation (upward or downward). The video also demonstrates how to graph quadratic functions using tables, with practical examples for functions like y = x² and y = 2x². It concludes by foreshadowing a future lesson on roots, intersections, and discriminants.
Takeaways
- 😀 The video covers quadratic functions, explaining the difference between quadratic equations and functions.
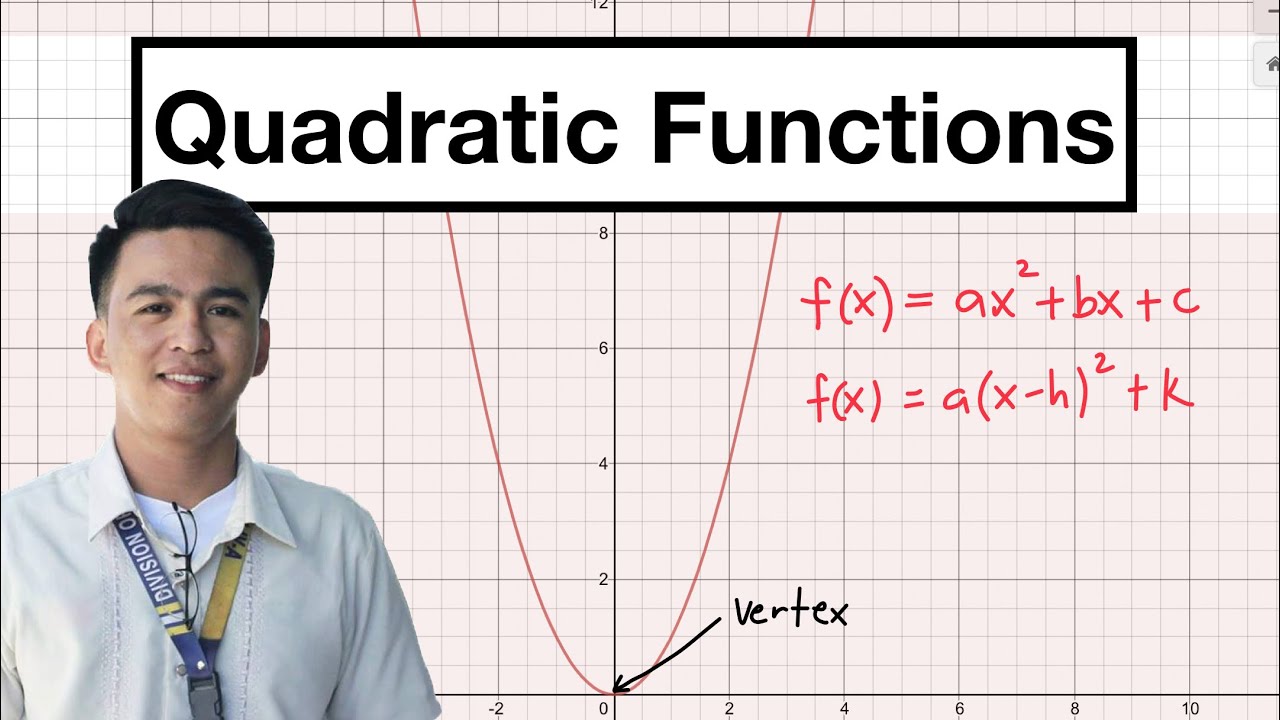
- 😀 A quadratic function has the general form y = ax² + bx + c, where a, b, and c are real numbers, and a cannot be zero.
- 😀 In contrast to quadratic equations, quadratic functions are written without the = 0 part; they are expressed as y = ax² + bx + c or f(x) = ax² + bx + c.
- 😀 The term 'f(x)' is often used as an alternative to 'y' when describing functions, and this was discussed in the context of previous lessons on relations and functions.
- 😀 A quadratic function can be identified by the presence of a squared term (ax²), and if 'a' equals zero, it's no longer a quadratic function.
- 😀 Quadratic functions can be represented as a parabola, either opening upwards or downwards, depending on the sign of 'a'.
- 😀 If 'a' is positive (a > 0), the parabola opens upwards, and if 'a' is negative (a < 0), the parabola opens downwards.
- 😀 The example y = x² - 5x + 8 demonstrates an upward-opening parabola, while y = -x² - 5x + 8 shows a downward-opening parabola.
- 😀 Graphing quadratic functions involves creating a table of values and plotting corresponding points on the Cartesian plane.
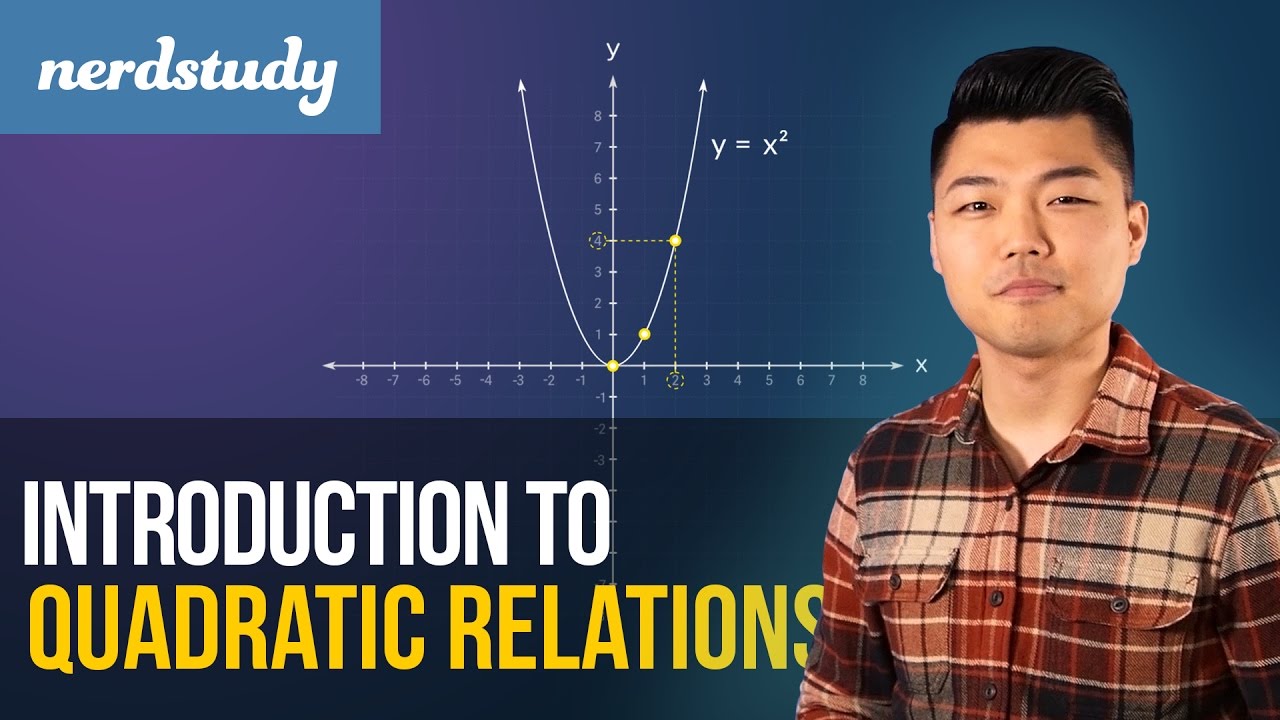
- 😀 To graph y = x² and y = 2x², a table of x-values (-2, -1, 0, 1, 2) is used, and the corresponding y-values are calculated and plotted to create the parabolic curves.
- 😀 The video emphasizes that understanding how to identify and graph quadratic functions is essential before diving into more advanced topics like x- and y-intercepts, as well as the discriminant.
Q & A
What is the main difference between quadratic equations and quadratic functions?
-Quadratic equations are of the form ax² + bx + c = 0, where the equation equals zero. Quadratic functions, on the other hand, are written as y = ax² + bx + c or f(x) = ax² + bx + c, where the equation is equal to y or f(x), allowing it to be graphed.
Why must the coefficient 'a' in a quadratic function not be zero?
-If 'a' is zero, the term ax² disappears, and the equation becomes linear (bx + c), not quadratic. The presence of the x² term is what defines a quadratic function.
What is the significance of the values a, b, and c in the general form of a quadratic function?
-In the general form y = ax² + bx + c, 'a' affects the direction of the parabola (upwards if positive, downwards if negative), 'b' affects the shape and symmetry, and 'c' represents the y-intercept, or the point where the graph crosses the y-axis.
How can we determine if a given equation is a quadratic function or not?
-A function is quadratic if it includes an x² term with a non-zero coefficient for 'a'. If the equation lacks the x² term, like in a linear function, then it's not a quadratic function.
What is the shape of the graph of a quadratic function?
-The graph of a quadratic function is a parabola. It can either open upwards if 'a' is positive or downwards if 'a' is negative.
How can we tell whether the graph of a quadratic function opens upwards or downwards?
-If the coefficient 'a' is positive, the parabola opens upwards. If 'a' is negative, the parabola opens downwards.
What are some real-life examples of parabolas?
-A real-life example of a parabola is the trajectory of a ball thrown in the air. The path it follows forms a curved shape known as a parabola.
How do you graph a quadratic function using a table of values?
-To graph a quadratic function, create a table by selecting values of x, calculating corresponding y values using the function, and plotting the points on a coordinate plane. Once plotted, connect the points to form the parabola.
What is the difference between the quadratic function y = x² and y = 2x²?
-The function y = x² represents a basic parabola with a vertex at the origin and a relatively moderate curvature. In contrast, y = 2x² has the same general shape but a steeper curve because the coefficient 'a' is larger (2 instead of 1), which makes the parabola narrower.
What are the next topics to be covered in the following lessons based on this video?
-The next topics to be covered are finding the x-intercepts and y-intercepts of a quadratic function, and understanding the discriminant.
Outlines

This section is available to paid users only. Please upgrade to access this part.
Upgrade NowMindmap

This section is available to paid users only. Please upgrade to access this part.
Upgrade NowKeywords

This section is available to paid users only. Please upgrade to access this part.
Upgrade NowHighlights

This section is available to paid users only. Please upgrade to access this part.
Upgrade NowTranscripts

This section is available to paid users only. Please upgrade to access this part.
Upgrade NowBrowse More Related Video
Intro to Quadratic Functions (Relations) - Nerdstudy

Persamaan Kuadrat •Part 1: Menyelesaikan Persamaan Kuadrat dengan Pemfaktoran / Faktorisasi Tipe 1&2
Introduction to Quadratic Function | Examples of Quadratic Function

Fungsi Kuadrat [Part 6] - Bentuk Umum Fungsi Kuadrat
Matematika Kelas 9 : Fungsi Kuadrat (Part 1 : Bentuk umum dan grafik fungsi kuadrat)
Maths - EB11 - S - chap2 - v1 - polynomes et equation du second degre
5.0 / 5 (0 votes)