Average Rate of Change
Summary
TLDRThis video explains the concept of average rate of change of a function, using visual aids like secant lines and examples. It illustrates how the slope of a secant line between two points on a graph represents the average rate of change of the function. Through real-world examples, such as calculating average speed during a trip, and mathematical functions, the video walks viewers through the steps of calculating average rate of change, emphasizing the importance of slope and the relationship between independent and dependent variables.
Takeaways
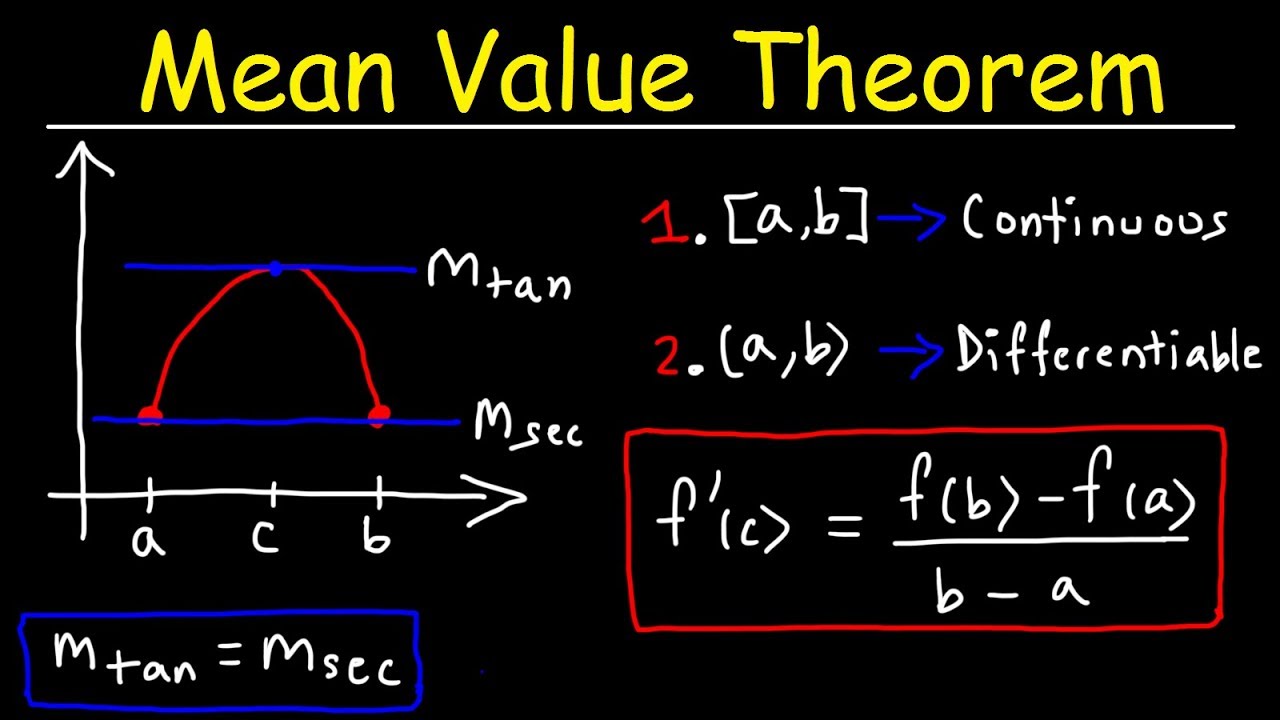
- 😀 The average rate of change of a function is represented by the slope of a secant line connecting two points on the graph.
- 😀 The slope of a line between two points is calculated using the formula: slope = (y₂ - y₁) / (x₂ - x₁).
- 😀 A secant line is a linear approximation of a function between two points, and its slope represents the average rate of change over that interval.
- 😀 When determining the average rate of change, you are essentially finding the slope of the secant line for the given points.
- 😀 As the secant line moves along the function, its slope (and thus the average rate of change) can change depending on the points chosen.
- 😀 An example is given where the average rate of change of a trip from Phoenix to Los Angeles is calculated using the formula rate = distance / time, resulting in an average speed of approximately 69 mph.
- 😀 The graph of a trip can show varying speeds; steeper sections of the graph correspond to faster travel and flatter sections correspond to slower travel.
- 😀 The average rate of change can vary depending on the specific points selected on the graph, such as comparing the overall trip vs. specific intervals of time.
- 😀 In a mathematical example, the average rate of change of the function f(x) = x² + 1 from x = 0 to x = 3 is calculated as 3 using the slope formula.
- 😀 Another example demonstrates the average rate of change from x = -2 to x = 1, where the result is -1, indicating a decrease in the function as x increases.
Q & A
What is the average rate of change of a function?
-The average rate of change of a function is defined as the slope of the secant line connecting two points on the function. It represents the change in the dependent variable (y) relative to the change in the independent variable (x) between those two points.
What does the slope of the secant line represent?
-The slope of the secant line represents the average rate of change of the function between two points. It is calculated as the change in the dependent variable (y) divided by the change in the independent variable (x).
How is the slope of a line between two points calculated?
-The slope of a line between two points is calculated using the formula: (y₂ - y₁) / (x₂ - x₁), where (x₁, y₁) and (x₂, y₂) are the coordinates of the two points.
What does the animation in the video show about the secant line?
-The animation shows how the slope of the secant line changes as the two points on the function move. It illustrates that the average rate of change varies depending on the selected interval between the two points.
What is the real-world example used to explain the average rate of change in the video?
-The video uses the example of a trip from Phoenix, Arizona to Los Angeles, California, where the distance traveled (380 miles) is divided by the time (5.5 hours) to determine the average speed or rate of change during the trip, which is approximately 69 miles per hour.
How does the graph of distance vs. time relate to average rate of change?
-The graph of distance vs. time shows how the distance changes over time. A steeper slope on the graph indicates a higher speed (faster travel), while a flatter slope indicates slower speed. The average rate of change can be represented by the slope of the secant line between any two points on the graph.
What does a positive or negative slope of the secant line indicate?
-A positive slope of the secant line indicates that the function is increasing between the two points, while a negative slope indicates that the function is decreasing between those points.
What does the average rate of change of the function from x = 0 to x = 3 mean in the example given?
-In the example, the average rate of change from x = 0 to x = 3 is 3. This means that for every unit increase in x, y increases by 3.
What does the negative average rate of change from x = -2 to x = 1 indicate in the second example?
-The negative average rate of change from x = -2 to x = 1 (which is -1) indicates that as x increases from -2 to 1, the value of y decreases by 1 for every unit increase in x.
Why is it important to express the average rate of change in its simplest form?
-Expressing the average rate of change in its simplest form helps to clearly communicate the rate at which the function is changing. This ensures that the interpretation of the rate is straightforward and easy to understand.
Outlines

This section is available to paid users only. Please upgrade to access this part.
Upgrade NowMindmap

This section is available to paid users only. Please upgrade to access this part.
Upgrade NowKeywords

This section is available to paid users only. Please upgrade to access this part.
Upgrade NowHighlights

This section is available to paid users only. Please upgrade to access this part.
Upgrade NowTranscripts

This section is available to paid users only. Please upgrade to access this part.
Upgrade NowBrowse More Related Video


5.0 / 5 (0 votes)