How Prometheus Monitoring Works | Explaining Prometheus Architecture | KodeKloud
Summary
TLDRThis video introduces Prometheus, an open-source monitoring tool designed to collect and visualize numeric time-series data from various sources like servers, applications, and databases. Key use cases include tracking system metrics (CPU, memory), setting up alerts for critical thresholds, and visualizing performance trends. Prometheus uses a pull-based model to scrape data from targets via HTTP endpoints, with flexibility for custom applications using client libraries. It integrates with exporters for common systems and supports alerting through an external tool called Alertmanager. The video also explains Prometheus' architecture, including its components like the time series database, query language (PromQL), and more.
Takeaways
- 😀 Prometheus is an open-source monitoring tool used for collecting and visualizing metric data from a variety of sources.
- 📊 Prometheus collects metrics through a pull-based model, where it scrapes data from targets exposed via HTTP endpoints.
- 🔔 Prometheus has built-in alerting capabilities, allowing users to set thresholds for metrics and notify teams via email, Slack, SMS, etc.
- 💻 Prometheus is designed to monitor numeric time-series data, such as CPU usage, memory utilization, and service uptime, but does not handle events or system logs.
- 📈 Prometheus integrates with various exporters that convert system data into a format it can scrape, such as node exporter for Linux or MySQL exporter for databases.
- 🌐 Prometheus can monitor both on-premise systems and cloud services (e.g., AWS), providing a centralized view of metrics across diverse environments.
- ⚡ Prometheus is built with flexibility, allowing users to monitor a wide range of applications, systems, and networks with custom and native exporters.
- ⚙️ The Prometheus architecture includes components like the data retrieval worker, time-series database, and HTTP server for querying data via the PromQL language.
- 📱 For short-lived jobs that don't fit the pull model, Prometheus uses a Push Gateway, allowing those jobs to push their data to Prometheus.
- 🔄 Service discovery enables dynamic updates to target lists in environments like Kubernetes, where instances can spin up or down frequently, avoiding manual configuration.
Q & A
What is Prometheus and what primary functionality does it offer?
-Prometheus is an open-source monitoring tool designed to collect metric data from various systems, applications, and services. It provides built-in visualization tools to display the collected data and includes alerting functionality to notify users when certain metrics exceed predefined thresholds.
How does Prometheus collect data from its targets?
-Prometheus collects data by sending HTTP GET requests to specific endpoints on the target systems. These endpoints expose metrics in a format that Prometheus understands, and Prometheus scrapes this data periodically to store in a time-series database.
What types of metrics can Prometheus monitor?
-Prometheus can monitor various types of metrics, including CPU and memory utilization, disk space, service uptime, and application-specific metrics such as errors, request latency, and pending requests. It is highly flexible in terms of the types of data it can track.
What is the architecture of Prometheus?
-The Prometheus architecture consists of three main components: a data retrieval worker that collects metrics, a time-series database that stores the metrics, and an HTTP server that allows users to query and visualize the data using Prometheus' built-in query language (PromQL).
What role do exporters play in Prometheus?
-Exporters are small processes that run on the target systems to expose their metrics in a format that Prometheus can scrape. Prometheus does not automatically collect metrics from most systems, so exporters are necessary to convert internal system data into Prometheus-friendly metrics.
What is the difference between Prometheus' pull-based model and a push-based system?
-Prometheus uses a pull-based model, where it actively scrapes metrics from targets. In contrast, push-based systems allow targets to send data to the server. While Prometheus requires explicit knowledge of all targets to scrape, push-based systems may result in overloads and don't provide the same certainty regarding target availability.
What is the Push Gateway in Prometheus?
-The Push Gateway in Prometheus is used to collect data from short-lived jobs that may not last long enough for Prometheus to scrape them via its pull-based model. These jobs push their metrics to the Push Gateway, which then allows Prometheus to scrape the data later.
How does Prometheus handle alerting and notifications?
-Prometheus itself triggers alerts based on predefined rules when metrics exceed set thresholds. However, Prometheus does not send the actual notifications. Instead, it pushes the alerts to an external component called Alertmanager, which is responsible for sending notifications through channels like email, Slack, or SMS.
What are the benefits of using Prometheus for monitoring multiple data centers and cloud services?
-Prometheus allows organizations to monitor multiple data centers and cloud services by collecting and centralizing metrics from various sources, displaying them on a unified dashboard. This helps organizations gain insights into their systems across different locations, improving overall system visibility.
How can Prometheus track custom application metrics?
-Prometheus provides client libraries for various programming languages (like Go, Java, Python, and Ruby) that allow developers to expose custom application metrics. These metrics could include error counts, request latencies, or job execution times, and Prometheus can scrape and store them just like any other system metric.
Outlines

This section is available to paid users only. Please upgrade to access this part.
Upgrade NowMindmap

This section is available to paid users only. Please upgrade to access this part.
Upgrade NowKeywords

This section is available to paid users only. Please upgrade to access this part.
Upgrade NowHighlights

This section is available to paid users only. Please upgrade to access this part.
Upgrade NowTranscripts

This section is available to paid users only. Please upgrade to access this part.
Upgrade NowBrowse More Related Video

What is MCP? Integrate AI Agents with Databases & APIs

Belajar Membuat Monitoring Resources dengan Node Exporter, Prometehus & Grafana | DevOps 101

Wazuh Explained: Role in Cybersecurity & SOC Defense - Part 01 #wazuh #blueteam @socpulse
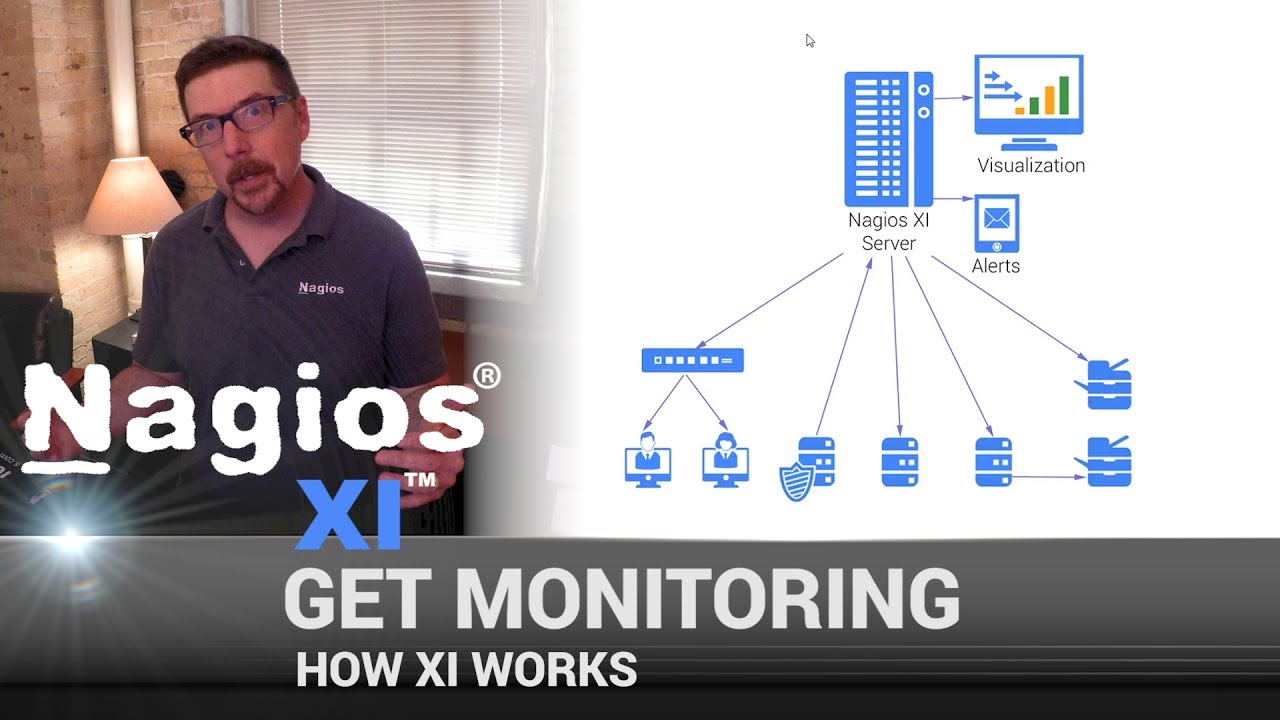
How Nagios XI Works

How Prometheus Monitoring works | Prometheus Architecture explained

🐥 Wren AI: Open-Source Text-to-SQL AI Agents!
5.0 / 5 (0 votes)