Pendekatan NDVI, GNDVI, SAVI dan NDWI (Qgis) - Analisis Spasial dan Lingkungan
Summary
TLDRIn this tutorial, the instructor guides viewers through the calculation of various vegetation indices using QGIS and raster calculation methods. Key indices covered include NDVI, GNDVI, and Safi, with each explained in detail, including the required formulas and how to interpret the results. The video also demonstrates the use of radiometric correction and clipping to prepare data, and emphasizes the importance of understanding the bands involved (blue, green, red, near-infrared). Additionally, the instructor touches on NDWI for water detection, providing insights into how these indices can aid in environmental analysis.
Takeaways
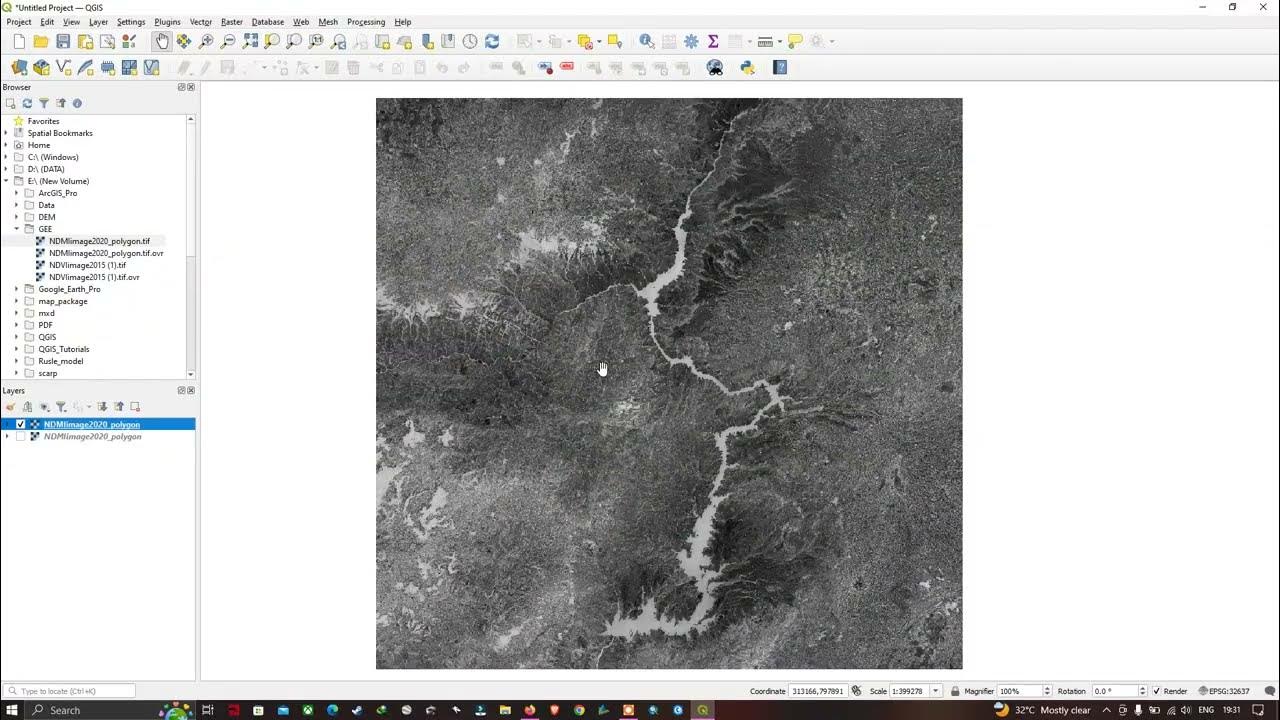
- 😀 The materials needed for the practical assignment include the clipped data and radiometrically corrected data, which are essential for accurate calculations.
- 😀 Before performing calculations, it's important to understand the bands used in the analysis: blue (band 2), green (band 3), red (band 4), and near-infrared (band 5).
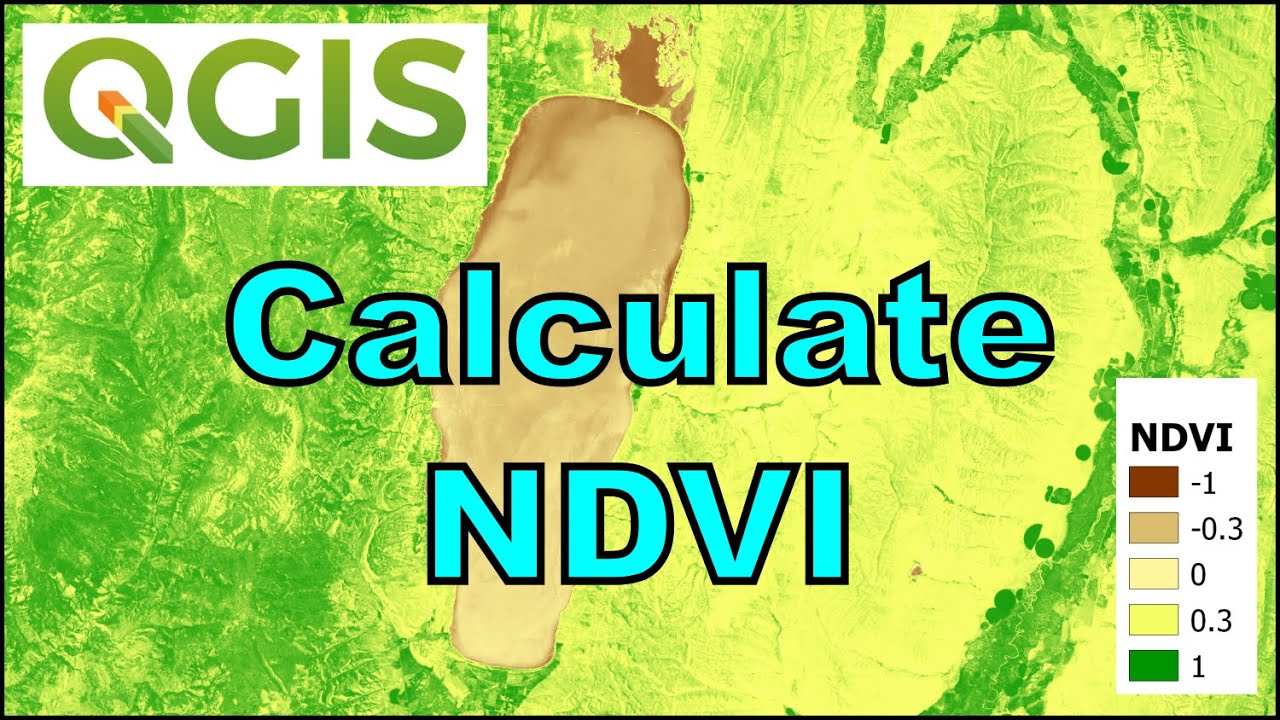
- 😀 The NDVI (Normalized Difference Vegetation Index) formula is calculated as (Near - Red) / (Near + Red). This formula helps in vegetation analysis.
- 😀 To calculate NDVI in QGIS, use the Raster Calculator tool, input the correct formula, and save the output with an appropriate name (e.g., 'NDP').
- 😀 The symbology of the NDVI output should be adjusted so that green represents high vegetation, while white indicates low or no vegetation.
- 😀 NDVI values typically range from -1 to 1. Higher values indicate more vegetation, and lower values indicate less or no vegetation.
- 😀 GNDVI (Green Normalized Difference Vegetation Index) is calculated similarly to NDVI but uses the green band instead of the red band, making it more sensitive to green vegetation.
- 😀 The formula for GNDVI is (Near - Green) / (Near + Green), and it can be calculated in the same way as NDVI using QGIS's Raster Calculator.
- 😀 Safi is another vegetation index that uses a specific formula, and the constant 'L' is set to 1 based on a journal reference. The formula involves a detailed mathematical expression.
- 😀 NDWI (Normalized Difference Water Index) is used for water analysis, and its formula is (Green - Near) / (Green + Near). The output should be saved as 'NDWI' and will help in detecting water bodies.
Q & A
What is the main purpose of the practical assignment in this session?
-The main purpose of the practical assignment is to apply NDVI, GNDVI, and TSM approaches using specific satellite data that has been clipped and radiometrically corrected. This ensures accuracy in the final results.
Why is radiometric correction important before starting the calculations?
-Radiometric correction is important because it removes atmospheric effects and ensures that the data reflects true surface conditions. This directly impacts the accuracy of the subsequent calculations and interpretations.
Which bands are relevant for the NDVI calculation, and why?
-The relevant bands for NDVI are the red (Band 4) and near-infrared (Band 5) bands. NDVI is calculated by subtracting the red band value from the near-infrared band and dividing the result by their sum. This is because vegetation reflects more near-infrared light and absorbs more red light.
What is the formula used to calculate NDVI?
-The NDVI formula is: (Near-infrared - Red) / (Near-infrared + Red). This formula helps to determine the presence and health of vegetation.
What does the NDVI result indicate in terms of vegetation?
-NDVI values range from -1 to 1, with higher values indicating more vegetation. A greener result means more vegetation, while a whiter result indicates little or no vegetation.
How do you visualize NDVI results using QGIS?
-In QGIS, after calculating NDVI, you can adjust the symbology by choosing a color gradient where greener values represent vegetation. The NDVI map will help visualize the extent of vegetation across the area of interest.
What does GNDVI stand for, and how is it different from NDVI?
-GNDVI stands for Green Normalized Difference Vegetation Index. It differs from NDVI in that it uses the green band (Band 3) instead of the red band. GNDVI is often used for more accurate vegetation monitoring, especially in agricultural applications.
What is the significance of the 'Safi' approach mentioned in the script?
-The 'Safi' approach is another vegetation index designed to enhance the NDVI methodology. It incorporates a factor 'L' and is seen as an updated or more refined version of the NDVI calculation for vegetation health analysis.
What is the formula used for the Safi index?
-The exact formula for the Safi index is not fully given, but it involves a modification of NDVI with a constant 'L' factor, which in this case is set to 1. This approach is seen as a more accurate representation of vegetation.
What is the role of NDWI in remote sensing?
-NDWI stands for Normalized Difference Water Index, and it is used to highlight water bodies in remote sensing data. It is calculated using the green band and near-infrared band with the formula: (Green - Near-infrared) / (Green + Near-infrared). NDWI helps differentiate water from vegetation and soil.
Outlines

This section is available to paid users only. Please upgrade to access this part.
Upgrade NowMindmap

This section is available to paid users only. Please upgrade to access this part.
Upgrade NowKeywords

This section is available to paid users only. Please upgrade to access this part.
Upgrade NowHighlights

This section is available to paid users only. Please upgrade to access this part.
Upgrade NowTranscripts

This section is available to paid users only. Please upgrade to access this part.
Upgrade NowBrowse More Related Video
QGIS Remote Sensing - Calculate NDVI

90 - Orientação Objetos - Polimorfismo pt 01 - Introdução

Metode Perhitungan Indeks Harga
How to Import Raster layer in QGIS | QGIS 3.28 - Latest Tutorials

Ekonomi Kelas XI: Cara Menghitung Angka Indeks Tertimbang

MATERI INDEKS HARGA | MATERI EKONOMI KELAS XI SEMESTER GENAP KURIKULUM MERDEKA
5.0 / 5 (0 votes)