Gr 11: Geography development

Geography with Dave
8 Sept 202052:02

Summary

TLDRIn this Grade 11 geography lesson, the instructor reviews key concepts of development covered in Grade 9, emphasizing the terminology, economic, social, and demographic indicators. The lesson explains development as a process that improves people's quality of life, varying by perception. It covers the importance of measuring development, indicators like GDP, GNP, and the Human Development Index, and differentiates between more and less economically developed countries. The session also includes activities to reinforce understanding, aiming to help students apply their knowledge effectively.

Takeaways

  • 📚 Development involves a process of change that improves people's lives.
  • 🌍 The United Nations Development Program defines development as leading a long, healthy life, having access to knowledge, and a decent standard of living.
  • 📈 Economic, social, and demographic indicators are used to measure development.
  • 💡 Development is perceived differently based on people's previous conditions and current improvements.
  • 🏡 Importance of development includes determining the quality of life and identifying areas limiting progress.
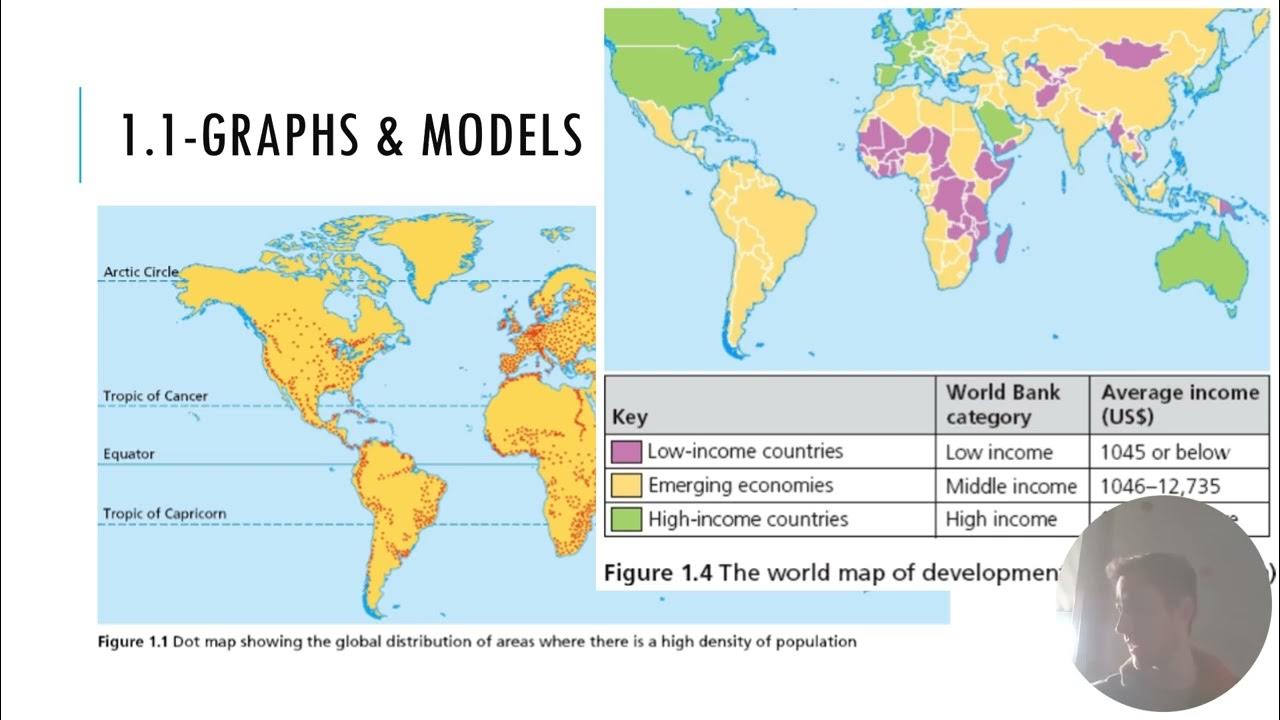
  • 💵 Economic indicators like GDP, GNP, and GDP per capita measure a country's economic output and development.
  • 👷‍♂️ The structure of the economy (primary, secondary, tertiary, quaternary activities) impacts development levels.
  • 📊 Social indicators such as literacy rates, access to healthcare, and life expectancy measure well-being and development.
  • 🔢 Demographic indicators provide statistics like birth rates, death rates, and population growth, influencing development.
  • 🌐 Human Development Index (HDI) combines economic and social factors to give a more comprehensive measure of development.

Q & A

  • What is the definition of development according to the United Nations Development Program?

    -Development is defined as leading a long, healthy life, being knowledgeable, having a good quality of life, access to resources, and the ability to participate in community life.

  • How does development vary based on perception?

    -Development varies based on what people had before and what they have now. For instance, moving from informal settlements to low-cost housing is considered development in poorer countries.

  • Why is measuring development important?

    -Measuring development is important to determine the level of development, identify areas limiting development, and develop strategies to improve development.

  • What are the three main types of development indicators?

    -The three main types of development indicators are economic, social, and demographic indicators.

  • What is Gross Domestic Product (GDP) and how is it measured?

    -GDP measures the value of goods and services produced within a country's borders by citizens and non-citizens for a specific period, usually a year.

  • What is the difference between GDP and Gross National Product (GNP)?

    -GDP includes goods and services produced within a country's borders by citizens and non-citizens, while GNP includes goods and services produced by a country's citizens both domestically and abroad.

  • What is the Gini coefficient and what does it represent?

    -The Gini coefficient represents income inequality within a nation, with a score ranging from 0 (full equality) to 1 (no equality).

  • How do economic indicators like GDP per capita help in understanding development?

    -GDP per capita measures the country's economic output per person, providing a better idea of the average income and quality of life, which helps in understanding economic development.

  • What are some examples of social indicators of development?

    -Examples of social indicators include literacy rates, access to healthcare, life expectancy, and the risk of diseases.

  • What is the Human Development Index (HDI) and what does it measure?

    -The HDI measures the level of human development based on three key dimensions: a long and healthy life, access to education, and a decent standard of living. It ranges from 0 (worst quality of life) to 1 (perfect quality of life).

Outlines

00:00

📘 Introduction and the Importance of Development

In this introductory section, the speaker addresses the topic of development for Grade 11 students. They emphasize that many of the concepts discussed are familiar from Grade 9 geography, ensuring students should be able to grasp them quickly. The speaker apologizes for not having professional studio quality and highlights that understanding development involves examining economic, social, and demographic indicators. The United Nations Development Program's definition of development is outlined, which includes aspects like leading a long and healthy life, having knowledge, and accessing necessary resources. The core idea is that development is a process of change that improves the quality of life as perceived by individuals.

05:01

🌍 Exploring Development and Its Indicators

This paragraph delves deeper into why measuring development is crucial. It helps determine the quality of life and identify areas that limit development, such as the lack of processed goods. The speaker discusses the need for strategies to enhance development, including human resource development. The concept of development indicators is introduced, which measure a country's economic, social, and institutional growth. These indicators include economic metrics like GDP and GNP, social measures like health and education, and institutional factors. The importance of understanding these indicators for analyzing development levels is emphasized.

10:02

💰 Economic Indicators of Development

Focusing on economic indicators, the speaker explains how GDP and GNP are used to measure the economic output of a country. GDP covers goods and services produced within a country's borders, while GNP includes the production by a country's citizens, both domestically and abroad. The concept of per capita GDP is introduced, highlighting that it's a better indicator of economic development as it accounts for population size. The example of China is used to illustrate how a high GDP does not necessarily translate into a high per capita income due to its large population. The distinction between GDP and GNP helps understand the size and economic health of a country.

15:04

🏭 The Structure of the Economy

This section discusses the different sectors of the economy—primary, secondary, and tertiary activities—and their roles in development. Primary activities involve the extraction and harvesting of resources, like agriculture and mining. Secondary activities involve processing raw materials into goods, such as manufacturing. Tertiary activities provide services like education, health, and commerce. The speaker also introduces the quaternary sector, which involves information processing and research. Understanding the distribution of employment across these sectors helps gauge the level of development, as more developed countries tend to have more employment in tertiary and quaternary sectors.

20:06

👩‍🏫 Social Indicators and Their Impact on Development

The focus shifts to social indicators, which measure the well-being of people through access to services like education, healthcare, and adequate shelter. Social indicators also include literacy rates and life expectancy. The speaker compares these indicators between more and less economically developed countries, showing how higher literacy rates and better access to services contribute to development. The importance of human resource development is emphasized, highlighting how investing in people's skills and education boosts overall development.

25:09

👶 Demographic and Health Indicators

This paragraph covers demographic indicators that provide statistical insights into a country's population, such as birth rates, death rates, and infant mortality rates. These indicators are often higher in less developed countries due to inadequate healthcare and other services. The speaker explains that these figures are crucial for understanding the quality of life and overall development. For example, high infant mortality rates and low life expectancy are indicative of lower development levels. These indicators help identify areas where improvements can significantly impact a country's development.

30:10

📚 Access to Education and Technology

Education and technology are crucial indicators of development. The speaker highlights how access to primary, secondary, and higher education differs between more and less developed countries. Higher literacy rates and better educational opportunities correlate with greater development. Access to technology, such as mobile phones and the internet, also plays a significant role in development. More developed countries have higher access rates, which facilitate better communication, learning, and economic activities, further enhancing development.

35:13

📊 Understanding the Human Development Index (HDI)

The Human Development Index (HDI) is introduced as a composite measure that includes both social and economic indicators. It assesses three key dimensions: a long and healthy life, access to education, and a decent standard of living. The HDI ranges from 0 to 1, with higher values indicating better quality of life and development. This measure is more comprehensive than purely economic indicators as it encompasses multiple aspects of development. The speaker underscores the importance of the HDI in providing a balanced view of a country's development level.

40:13

📈 Demographic Statistics and Development

This section delves into demographic statistics, such as age-specific death rates, population growth rates, and sex ratios. These figures provide concrete data to analyze development trends and are crucial for understanding the population dynamics of a country. The speaker explains that demographic indicators are the foundation for deriving social and economic indicators. For instance, life expectancy and infant mortality rates directly impact social development measures. These statistics offer valuable insights into the population's well-being and the overall development status.

45:13

🏢 Comparing More and Less Economically Developed Countries (MEDCs and LEDCs)

The speaker revisits the concepts of more and less economically developed countries (MEDCs and LEDCs). MEDCs are highly industrialized with advanced technology and a significant focus on tertiary activities. They have high access to healthcare, education, and other services. LEDCs, on the other hand, struggle with structural impairments and rely heavily on primary sector activities. The speaker discusses the geographical distribution of MEDCs and LEDCs and introduces the notion of newly industrialized countries (NICs), which are transitioning from LEDCs to more developed status, like China and India.

50:14

🌍 Case Study: Economic and Social Indicators in Different Countries

The speaker provides a comparative analysis of various countries using specific economic and social indicators. For instance, Kuwait and Bangladesh are compared in terms of GNP per capita, literacy rates, and life expectancy. These comparisons highlight the vast differences in development levels. The speaker emphasizes that understanding these indicators helps identify development challenges and opportunities. The analysis underscores the importance of comprehensive measures to accurately assess and compare development across different countries.

📖 Review and Reflect on Development Concepts

In the closing section, the speaker summarizes the key points covered in the lesson. They reflect on the importance of applying knowledge about development and understanding its indicators. The lesson emphasizes that development is multifaceted, involving economic, social, and demographic aspects. The speaker encourages students to think critically about these concepts and their applications in real-world scenarios. A brief activity is suggested to reinforce the learning, asking students to differentiate between development and development indicators, identify important measures, and classify countries based on their development status.

Mindmap

Keywords

💡Development

Development refers to the process of change that improves people's quality of life. In the video, it is described as a multifaceted concept that includes economic, social, and demographic improvements. For instance, moving from informal settlements to low-cost housing is an example of development, as it enhances living conditions.

💡Economic Indicators

Economic indicators are metrics used to assess the economic development of a country. In the video, GDP (Gross Domestic Product) and GNP (Gross National Product) are discussed as measures of the value of goods and services produced, which help in understanding a country's economic performance. For example, the video explains how GDP per capita provides insight into the average income and economic development level.

💡Social Indicators

Social indicators measure the well-being and quality of life of people in a society. These include literacy rates, access to education, healthcare, and services. The video emphasizes how higher literacy rates and better access to services in more economically developed countries (MEDCs) contribute to higher quality of life and overall development.

💡Demographic Indicators

Demographic indicators are statistical measures that describe the characteristics of a population, such as birth rates, death rates, and life expectancy. The video highlights how these indicators provide insights into the health and development status of a country, noting that higher life expectancy and lower infant mortality rates are common in MEDCs.

💡Gross Domestic Product (GDP)

GDP is the total value of all goods and services produced within a country's borders over a specific period. In the video, GDP is used to illustrate the economic size of a country, with examples showing how GDP is a primary indicator of economic activity. For instance, South Africa's GDP is discussed in terms of its contribution to understanding economic development.

💡Human Development Index (HDI)

HDI is a composite index that measures a country's average achievements in health, education, and income. The video describes HDI as a reliable indicator of development that combines economic and social factors, providing a broader understanding of human well-being. It includes metrics like life expectancy and educational attainment.

💡Gini Coefficient

The Gini Coefficient measures income inequality within a nation, ranging from 0 (perfect equality) to 1 (maximum inequality). The video uses South Africa's Gini Coefficient to demonstrate how economic disparities can impact overall development. A higher score indicates greater inequality, which is more common in less economically developed countries (LEDCs).

💡Primary, Secondary, Tertiary Sectors

These sectors categorize economic activities. The primary sector involves extraction of raw materials, the secondary sector involves manufacturing, and the tertiary sector involves services. The video explains how the distribution of employment across these sectors can indicate a country's level of development, with more developed countries having higher employment in the tertiary sector.

💡Newly Industrialized Countries (NICs)

NICs are countries that are transitioning from LEDC to MEDC status, with rapidly growing economies and increasing industrialization. The video mentions countries like China and Malaysia as examples of NICs, highlighting their movement towards more developed status through industrial growth and economic diversification.

💡Per Capita Income

Per capita income is the average income earned per person in a given area, calculated by dividing the GDP by the population. The video discusses how per capita income provides a more accurate reflection of individual economic well-being and is used to compare living standards between countries. For example, China’s GDP per capita is used to illustrate differences in income distribution.

Highlights

Introduction to the topic of development and its significance in grade 11 geography.

Explanation of the United Nations Development Program's definition of development, emphasizing a long, healthy life, access to resources, and a decent standard of living.

Simplified definition of development as a process of change that affects people's lives and involves an improvement in the quality of life.

Discussion on the importance of development in determining the level of development, quality of life, and identifying areas limiting development.

Introduction to development indicators and their role in measuring the level of development, including economic, social, and demographic indicators.

Explanation of economic indicators such as Gross Domestic Product (GDP), Gross National Product (GNP), and per capita GDP.

Detailed breakdown of primary, secondary, and tertiary economic activities and their relevance to development.

Introduction to quaternary activities involving information processing and research, highlighting their importance in modern economies.

Comparison of less economically developed countries (LEDCs) and more economically developed countries (MEDCs) based on the employment distribution across economic sectors.

Social indicators of development, including literacy rates, access to healthcare, and quality of life.

Human Development Index (HDI) as a comprehensive measure of development, combining economic and social indicators.

Demographic indicators providing statistical data on population age structures, mortality rates, and life expectancy.

Examples of MEDCs and LEDCs with specific comparisons, highlighting the disparities in income, literacy, and life expectancy.

Introduction to Newly Industrialized Countries (NICs) and their characteristics, positioning them between LEDCs and MEDCs.

Summary activity reinforcing the concepts covered in the lesson, including development, development indicators, and their classifications.

Transcripts

play00:02

[Music]

play00:08

hello learners

play00:10

hope that you are keeping well and uh

play00:13

apologies uh for the

play00:18

shine in my eyes i don't have those

play00:20

studios

play00:21

right maybe i've got a natural shine in

play00:23

my eyes

play00:24

okay so i do apologize for that i hope

play00:27

it doesn't affect you much i have to use

play00:29

other forms of

play00:30

writing at home okay i'm not in the

play00:33

studio

play00:34

okay but our grade 11 lesson

play00:37

today is actually on development

play00:41

now one thing you must realize you must

play00:44

say you may be saying to yourself

play00:46

i remember these things all right uh

play00:49

some of these concepts i know already

play00:52

and yes you do

play00:53

because in your grade nine geography you

play00:58

covered a lot of these concepts already

play01:01

so if you do still have your

play01:04

grade 9 geography books which i hope you

play01:06

do

play01:07

and you go over that you'll find there's

play01:09

so many things

play01:11

that you've already covered okay so it's

play01:14

nothing new to you so we expect good

play01:16

marks

play01:17

for this section all right

play01:21

so let's get going

play01:24

what we will be looking at here the

play01:27

terminology associated with development

play01:30

sounds familiar grade 9a the

play01:34

concept of development

play01:37

the economic social and demographic

play01:41

indicators of development

play01:44

and we're going to look at examples

play01:48

all right to illustrate the difference

play01:51

in development all right just simple

play01:54

examples

play01:56

will be coming across factors etc in

play01:58

later lessons

play02:00

okay so very familiar to you from grade

play02:03

nine all right but let's go on

play02:06

so we should be getting good marks all

play02:09

right let's first of all look

play02:11

at what is development

play02:15

all right and first of all let's look at

play02:18

the united nations development program

play02:21

how he defines it

play02:22

he defines it as leading a long

play02:25

healthy life to be knowledgeable

play02:30

so good quality of life to have skills

play02:34

to have access to resources

play02:37

all right whether it's your needs

play02:40

you understand housing again education

play02:45

sanitation uh

play02:49

institutions for study and i'm repeating

play02:52

myself

play02:53

all these things to have a decent

play02:57

standard of living all right

play03:00

to live comfortably and be able to

play03:04

participate in life of the community you

play03:07

can actively participate

play03:09

so includes all that in terms of even

play03:12

the quality

play03:14

of life of a person okay that's a bit

play03:16

long name

play03:17

let's shorten it a bit okay so simply

play03:20

put

play03:22

development is a process of change

play03:26

that affects people's lives it may

play03:30

involve

play03:32

an improvement in the quality of life

play03:36

as perceived by people

play03:39

undergoing change all right

play03:43

how they perceive it remember that is

play03:45

development

play03:46

okay you may get situations where

play03:50

somebody all the learners in the schools

play03:54

got laptops that's development

play03:56

but let's take a poorer country

play04:00

moving from informal settlements

play04:04

or checks to low-cost housing

play04:07

is a development so it varies it depends

play04:11

on how we perceive

play04:13

development based on what we had and

play04:16

what we

play04:16

now have that is development so it's

play04:19

different

play04:20

in terms of perception all right but we

play04:22

all want to head through where we have

play04:24

all the skills etc okay

play04:28

right now importance of development i

play04:32

know i've added this on

play04:34

but it's necessary to know why

play04:37

development

play04:38

is important all right

play04:42

okay why do we measure this development

play04:44

and why is development is important

play04:46

it determines the level to determine the

play04:49

level of development

play04:50

you understand okay to determine the

play04:53

level of the where

play04:54

are we now where should we be where can

play04:57

we be

play04:58

right to determine the average quality

play05:00

of life of the citizens

play05:03

okay what's the quality of life it's

play05:05

glow

play05:06

how could we up it because it makes us

play05:07

start thinking hey

play05:09

all right makes us start thinking all

play05:11

right can you see why i have included

play05:12

this

play05:14

uh identify areas limiting development

play05:17

now why

play05:17

is it what are the factors we are not

play05:20

processing enough goods we selling our

play05:22

raw materials

play05:24

so let's make a change so we develop

play05:26

strategies

play05:27

to handle the problem to improve

play05:30

development

play05:31

i've taken this from grade nine all

play05:33

right but it does bring out

play05:34

significance so now we say let's invest

play05:38

in

play05:39

processing our raw materials so we can

play05:41

have

play05:42

we need more skills we'll train more

play05:44

people can you see it so development is

play05:46

not just a theoretical thing

play05:48

that we just learned and given exams it

play05:50

makes us think

play05:51

and in future years maybe you will be

play05:53

involved

play05:54

in working and developing the country i

play05:58

hope so

play05:58

you are geographers all right can you

play06:01

see here it talks about

play06:02

human resource development that's a big

play06:05

thing

play06:06

all right we tend to focus on other

play06:08

things but

play06:09

like infrastructure which is important

play06:11

but we need to develop our human

play06:13

resource

play06:14

develop our people you understand that

play06:17

is very very important we can have the

play06:20

technology

play06:21

you understand but we need to develop

play06:23

the people

play06:24

you want to set user technology also

play06:27

okay

play06:31

development indicators it's going to be

play06:34

so important

play06:35

as we go through these sections what are

play06:38

development

play06:39

indicators they measure

play06:42

the level of development

play06:45

can you see with regards to the

play06:47

country's economic

play06:49

social and institutional growth

play06:52

all right in terms of uh economic

play06:56

how much money in comparison to others

play06:58

we measure

play06:59

how much money we made the gnp the gdp

play07:02

cross domestic product cross national

play07:04

product we

play07:06

measure it to see where we stand okay

play07:09

social you understand the health of the

play07:12

people

play07:13

the debt rate the birth rate you

play07:15

understand

play07:16

all these things we start looking at the

play07:18

institutional growth

play07:20

of infrastructure institutions village

play07:22

universities colleges whatever

play07:24

you understand we do all that and

play07:26

generally it's a numerical

play07:28

measure okay of the quality of life can

play07:32

you see here

play07:34

we have gdp in u.s dollars

play07:37

right we have uh

play07:40

per person gdp okay we look at all these

play07:44

things we look at the figures

play07:46

all right later on we'll be doing uh the

play07:48

genie coefficient we look at the figures

play07:51

all right uh the number of years in

play07:54

school and we look at figures

play07:55

so i'm not going to go into detail in

play07:57

all this but we give exact

play07:59

or sort of average figures for each

play08:02

thing

play08:02

all right and that's how we work through

play08:04

it so it's numerical

play08:06

which makes us easier to analyze it

play08:11

and of course again by measuring it it

play08:13

compares the level of development

play08:17

okay why are we here who's there who's

play08:20

developing

play08:21

or ledc low uh less economic developers

play08:25

more economic developed how can we

play08:27

improve we look at all these

play08:30

statistics and again there's three types

play08:32

social

play08:34

uh economic and

play08:37

we also look at environmental

play08:40

but we are not going to look so much at

play08:44

environmental yet we're going to put it

play08:46

as a

play08:47

factor all right we can look

play08:51

more at demographic

play08:54

indicators these are the stats

play08:57

okay now example of indicators are

play09:02

gross domestic product human development

play09:05

index don't worry about the explanation

play09:08

of this it's gonna come to you now

play09:11

so don't stress all right the indicators

play09:14

will be explained in the presentation

play09:19

okay right let's go on

play09:26

now economic indicators

play09:29

is our first one we're gonna do it

play09:31

economic

play09:32

social and we're gonna bring in the

play09:33

demographic indicators

play09:35

right what does this do it

play09:38

looks at the economic development of the

play09:41

country

play09:43

the economic development of a country

play09:46

the finance the money

play09:48

earning you understand the average

play09:50

income

play09:51

all this is economic remember the impact

play09:55

you understand the impact that you look

play09:57

at the per capita

play09:59

gdp the average for it for the people

play10:02

across the country

play10:03

it impacts on the social obviously if

play10:06

it's higher you have a better social

play10:07

life so they don't work

play10:09

independently but they work hand in hand

play10:12

eh

play10:13

right this is the most common method of

play10:16

measuring development

play10:18

all right when we look at the financial

play10:20

situation

play10:21

of course the money makes everything

play10:23

happen hey

play10:24

all right not total happiness always

play10:26

it's other issues

play10:27

but it makes you be able to afford

play10:30

things

play10:31

okay so the first one we look at is the

play10:33

grass domestic product

play10:35

also known as the gdp i told you we're

play10:37

gonna cover this

play10:38

in more detail now this measures the

play10:41

value of goods and services

play10:46

produced within the

play10:49

country's borders so if it's south

play10:52

africa

play10:53

it's within south africa not outside

play10:57

okay so it's within the country what's

play11:00

goods and services produced and it's by

play11:03

citizens and non-citizens

play11:07

so it's alive it's by south africans and

play11:10

people who came into south africa from

play11:12

other countries

play11:14

okay that's your gdp within the country

play11:18

and by citizens and not citizens for a

play11:21

specific

play11:22

period okay like in many cases

play11:25

a year they measure it for it each year

play11:28

you understand and how much you can see

play11:31

whether it's improving

play11:32

or it's decreasing whatever then gross

play11:37

national product gnp

play11:41

measures again the value of goods and

play11:43

services

play11:45

produced only by only

play11:48

a country's citizens only by south

play11:52

africans okay but the difference here

play11:56

now is not only by south africans

play11:58

it includes the excludes the

play12:00

non-citizens

play12:01

but it's produced both domestically

play12:04

and abroad so south africa is producing

play12:07

in the country and

play12:08

outside the country for a specific

play12:12

period again

play12:13

generally we find a year for each eighth

play12:16

measure so they can compare

play12:17

so we have these two all right now

play12:23

what we must know to be learners

play12:27

is that these are used to indicate the

play12:31

size of a country's economy

play12:35

all right generally already used for

play12:37

development

play12:38

but the size of a country's economy not

play12:41

necessarily how developed it

play12:42

is okay i'll show you examples just now

play12:46

all right the gdp is the main

play12:50

indicator more than the gnp the gdp is

play12:53

used

play12:54

all right but let's bring in another

play12:56

concept

play12:57

per capita gross domestic product

play13:01

all right or gdp as it's known as

play13:04

what is this is the country's economic

play13:07

output

play13:08

per person and it's calculated by

play13:13

dividing the gdp of the country

play13:16

by its population so we say

play13:20

this is the amount earned so many

play13:22

billion dollars maybe south africa 500

play13:24

billion i'm just giving an example

play13:26

we take the number of people in the

play13:29

country and divide it

play13:30

okay and that gives you an average

play13:32

income okay it's not the best

play13:34

but it gives you a better idea of how

play13:36

developed we are

play13:37

the quality of life that people are

play13:40

living

play13:41

so it's actually a better indicator of

play13:44

economic development all right

play13:48

i will show you an example here let's

play13:49

take china

play13:51

twelve point two three two four trillion

play13:55

dollars fifteen point four

play13:58

percent of the world's

play14:02

well there it's huge you understand

play14:05

and they unite second to the united

play14:08

states

play14:09

all right but remember china has

play14:13

uh said to be corrected but maybe more

play14:16

than 1.5 billion people

play14:19

large number so if you take you you may

play14:21

be in your house

play14:23

you have maybe 20 people

play14:27

a big family all right and you earn

play14:31

80 000 rent if you divide it by the

play14:34

people

play14:35

it'll come to 4 000 grand per person

play14:39

okay let's take your neighbor your

play14:42

neighbor earns

play14:43

40 000 rare you understand

play14:46

and he has uh maybe two people in the

play14:50

family

play14:51

okay or let's put it four people let's

play14:53

make it a bigger family too

play14:55

and he ends forty thousand rand now if

play14:58

you divide it by the four people

play15:01

okay it comes to ten thousand rand per

play15:03

person

play15:04

okay so you may and eighty eighty

play15:06

thousand grand but

play15:07

you're twenty people each person gets

play15:10

you

play15:11

send four thousand grand your neighbor

play15:13

earns forty thousand rand

play15:15

and you divided by his four members it

play15:17

comes to ten thousand rand

play15:19

so his average is higher so do not be

play15:22

fooled by the

play15:23

gdp which huge depends on the number of

play15:27

people

play15:27

that is what i'm saying but if you look

play15:29

at the gdp

play15:30

per capita income you'll notice

play15:34

china doesn't even appear in the top ten

play15:37

can you see

play15:38

doesn't appear because the average

play15:41

income is

play15:42

much lower okay so that's also a factor

play15:45

in

play15:46

development that we must remember

play15:50

okay we must remember that a very very

play15:53

important

play15:55

right let us go on

play16:01

now other economic indicators the gini

play16:05

coefficient all right nothing dealing

play16:09

with those

play16:09

fairy tales hey the genie comes out of

play16:11

the lamp this is our

play16:13

geography okay now it represents

play16:16

the income inequality

play16:19

or wealth inequality within a nation

play16:23

all right it shows maybe there's a lot

play16:26

of

play16:26

there's rich people and then there's

play16:28

very four people

play16:29

people facilities people no facilities

play16:32

etc

play16:32

so we work on that now what we have here

play16:36

is score ranges from

play16:37

zero to one

play16:40

a zero shows full equality

play16:45

and one shows no equality so watch out

play16:47

some

play16:48

indices are differently so if you

play16:50

getting a score of

play16:51

of zero it's totally equal of course

play16:54

it's difficult to get a source called

play16:55

zero but score closer to zero

play16:59

is excellent you understand because it

play17:01

shows more equality

play17:03

there's not extremely rich extremely

play17:04

poor etc

play17:06

okay and one shows no way equality

play17:09

across the country

play17:10

you understand no equality okay example

play17:14

south africa we have very rich people

play17:16

and a lot of poor people

play17:18

the development is not properly spread

play17:21

across our country

play17:22

not properly and our score ranges from

play17:26

0.66

play17:28

0 to 0.696

play17:32

more towards the one not right at the

play17:35

one we're not that bad

play17:36

you understand but it's more that side

play17:38

can you see it

play17:39

so in terms of inequality

play17:43

or equality there's a challenge and

play17:45

that's how the genie coefficient is

play17:47

worked

play17:48

can you see higher scores in the less

play17:51

economically developed countries

play17:53

eh can you see it

play17:56

in terms of 0.65 etc

play17:59

and then as we move through the

play18:01

developed countries

play18:03

we find this better equality

play18:06

where the scores now go towards 0.35

play18:10

0.25 etc okay

play18:13

there's more equality in the more

play18:15

economically developed

play18:16

countries then another

play18:20

economic uh

play18:23

economic indicator is structure of the

play18:26

economy

play18:28

all right what do you mean by structure

play18:30

you're going to come across this

play18:31

in grade 12 also let us exactly the same

play18:34

things

play18:35

now we have a structure where we divide

play18:37

it into different

play18:38

activities okay like primary activities

play18:43

all right this is extracting or

play18:45

harvesting

play18:46

products from the earth such as your

play18:50

basic foods

play18:51

your raw materials examples are

play18:54

agriculture mining

play18:56

forestry fishing like these young ladies

play19:01

they very happy because they're eating

play19:03

healthy with those vegetables

play19:05

therefore they smiling that is the

play19:08

farming

play19:08

which is primary planting crops you

play19:12

understand getting basic foods

play19:14

from there this man the strong man here

play19:17

is mining all right he's taking out raw

play19:20

materials

play19:21

so that's primary so i need to go

play19:23

through these sectors

play19:25

in order to appreciate how it involves

play19:27

development

play19:29

all right then we got

play19:32

secondary activities which is

play19:35

processing that is manufacturing or

play19:38

transforming

play19:39

raw materials into products of goods

play19:42

this young lady all right is

play19:46

sowing clothes but the cotton which was

play19:48

farm now it's sowing

play19:50

you understand yeah they're using the

play19:53

iron and steel

play19:55

okay first it was i know it was

play19:57

developed into iron and steel

play19:59

and they manufacturing the cars

play20:02

this is secondary can you see iron

play20:05

ore to iron and steel food manufacturing

play20:09

which is not the basic now you take the

play20:11

food

play20:12

and you make cereals with it it looks

play20:15

slightly different now

play20:16

you take the sugarcane you make sugar

play20:18

textile manufacturing like the young

play20:20

lady

play20:21

or at motor vehicle manufacturing this

play20:24

is secondary activities

play20:26

okay then we go on

play20:30

then we have tertiary activities and we

play20:32

know this is the provision of

play20:34

services okay that's education yeah

play20:39

teaching is a service the health

play20:42

department

play20:43

public health safety not just health

play20:45

department public health safety

play20:47

to offering a service to make sure

play20:48

things are safe

play20:50

all right with those people so it's a

play20:52

wide range this is very wide from

play20:54

commerce

play20:55

to administration buses

play20:59

all the businesses etc administration

play21:02

you understand to transport because

play21:05

that's a service

play21:06

the construction may be building but

play21:08

there is roads offer

play21:10

service to people moving around

play21:11

financial

play21:13

you understand your banks etc real

play21:16

estate

play21:18

your activities your

play21:21

selling of houses personal services

play21:25

businesses education

play21:28

health like hospitals etc social workers

play21:32

so there's various say right

play21:36

then we have quaternary

play21:39

before we just said three as the years

play21:41

went by this

play21:43

true way this is pro getting

play21:46

processing and sharing of information

play21:50

all right this is quite nearly it

play21:52

involves things like

play21:53

research which is very important

play21:57

you understand for development okay uh

play22:01

because you research new things you come

play22:03

up with new ideas to improve development

play22:05

for

play22:06

machinery whatever and then we have

play22:09

things like sharing of

play22:10

information gis geographic information

play22:13

systems

play22:14

you should know it by now but how

play22:16

information is shared and manipulated

play22:19

you understand where you can drop your

play22:21

maps you can find

play22:22

areas that are good you can observe

play22:24

things all right

play22:26

through digital stuff okay so that's

play22:29

your quaternary

play22:31

and now what we notice by looking at the

play22:34

number of

play22:35

people employed in different economic

play22:38

sectors

play22:39

gives us an indication of the level of

play22:41

development

play22:42

we look at these two here learners right

play22:46

less economically developed country more

play22:49

people employed in the primary sector

play22:52

they still getting the raw materials

play22:56

so there's not much uh exports of

play22:59

process goods

play23:01

you understand raw materials may be

play23:03

exported

play23:04

because most people are employed in that

play23:07

i do apologize

play23:08

for that what am i looking at here i'm

play23:10

looking at this one

play23:11

and not uh the uk my apologies hey

play23:15

i'm looking at kenya here most of them

play23:18

are employed in the

play23:19

primary sector but look at the uk let's

play23:22

get back to this one made my job easier

play23:25

because now i don't have to

play23:28

uh draw my yellow line and look at the

play23:32

uk

play23:33

most of them are involved in the

play23:35

territory

play23:36

you understand the institution they're

play23:38

building technology

play23:40

and technology is helping with

play23:42

industrialization

play23:44

uh processes are speeding up in fact if

play23:46

you look at certain things computers

play23:48

are just making the cars humans just

play23:50

press a button and the computer hands

play23:52

come and sort things out

play23:54

so they growing in research technology

play23:58

with quaternary service tertiary

play23:59

services therefore they are more

play24:02

developed so more economically developed

play24:05

countries

play24:06

uh people are more employed in the

play24:09

tertiary sector

play24:10

which shows more development okay

play24:13

can you see how it was important for us

play24:15

to go through the

play24:16

sectors in order to get to that

play24:19

conclusion

play24:21

okay then social indicators

play24:25

again learners this is grade 9 again

play24:28

all right but we're revising it it

play24:31

measures the

play24:32

well-being of the people in terms of

play24:35

social needs

play24:36

such as access to adequate shelter

play24:40

services education healthcare their list

play24:44

is endless

play24:46

all right and the ability to take part

play24:48

fully

play24:49

in society and all that is offers

play24:53

so the quality of life of the people

play24:56

okay and once again you look at it

play24:59

you know you find all these more

play25:02

economically developed countries

play25:05

can you see with regards to uh

play25:09

literacy rate can you see how high they

play25:11

are compared to the

play25:12

less economically developed countries

play25:15

which are lower

play25:16

and you see they sit around here the

play25:19

dark blue

play25:20

and the light blue down there shows us

play25:23

these countries

play25:24

especially these ones are all above 95

play25:27

literacy rate and how much development

play25:30

if you've got skills in your country

play25:32

you understand you are developed so it

play25:34

looks at social indicators okay

play25:37

there's various social indicators all

play25:40

right

play25:41

we're going to just go through a list

play25:42

here all right

play25:44

uh

play25:47

what we're saying here is some

play25:49

democratic indicators from which social

play25:51

indicators

play25:52

are derived remember social indicators

play25:56

are derived from demographic which is

play26:00

statistics

play26:01

all right like birth rate the number of

play26:04

babies born

play26:06

in a country per thousand during a year

play26:09

all right is higher for less

play26:12

economically developed countries

play26:14

all right the death rate

play26:17

the number of deaths per thousand of

play26:20

people in the country

play26:22

is also higher for less economically

play26:24

developed countries

play26:26

because they don't have a full birth

play26:28

control the need

play26:29

and death rate they have facilities are

play26:31

not that good

play26:32

you understand so less uh

play26:35

or higher debt rates which affects

play26:38

development people die

play26:40

right the quality of life is poor infant

play26:43

mortality rates

play26:44

the number of newborns dying under the

play26:47

and

play26:47

one year one year of age divided by the

play26:50

number of live

play26:52

births obviously multiplied by a

play26:54

thousand

play26:55

but that tells you the number of people

play26:57

dying under one year

play26:59

all right that's the main focus and of

play27:02

course again it'll be

play27:04

higher for less academically developed

play27:06

countries

play27:07

because of lack of facilities like a

play27:10

lower income

play27:11

etc okay but here again learners i'm

play27:14

giving you a full thing

play27:15

if you know the number of newborns dying

play27:18

under

play27:19

one year of age that is fine for us all

play27:22

right

play27:23

life expectancy the total number of

play27:26

years

play27:27

a person is expected to live

play27:30

all right and you know obviously it'll

play27:32

be lower it'll be lower

play27:34

in the less economically

play27:37

developed countries because the health

play27:40

facilities

play27:41

are not as effective right and if it's

play27:44

low

play27:45

you understand the development will be

play27:49

low

play27:49

because people die earlier means they're

play27:51

not as healthy etc

play27:54

population growth rate is another one

play27:57

rate at which the number of individuals

play27:59

in the population increased

play28:01

in a given number of time again it's

play28:04

higher for less economically developed

play28:06

countries

play28:07

you understand people just grow and

play28:09

sometimes they need

play28:10

people to be born so that more people

play28:13

can work

play28:14

but lower incomes and adding together it

play28:17

makes more sense for them

play28:18

okay can you see i'm bringing in all

play28:20

this grade nine work

play28:22

which can help you to understand these

play28:24

indicators we not taught them a chance

play28:26

as i always say

play28:28

take a chance and leave out some

play28:29

concepts what if the examiner decides to

play28:32

test you on this

play28:33

all right if i look at this the infant

play28:36

mortality rate

play28:37

you can see it here all right

play28:41

and the blue shows you the developing

play28:44

nations can you see much higher

play28:48

and this is the developed nations the

play28:50

medcs

play28:52

all right and you can see it's much

play28:54

lower okay

play28:55

in each year it's much lower compared to

play28:58

that look at this

play28:59

the blue and the green the blue and the

play29:01

green the blue and the green

play29:03

much lower okay

play29:06

other social indicators okay

play29:10

again the more favorable in developed

play29:13

countries they're better off

play29:14

like poverty okay indicates the passage

play29:18

of people living below the poverty line

play29:21

with very small incomes

play29:25

access to basic services

play29:28

you know sanitation clean water

play29:31

pipe water etc the services available

play29:35

necessity for healthy lives such as

play29:37

clean water

play29:38

and sanitation they affect development

play29:40

also because the quality of life is

play29:43

affected

play29:43

and it's more in the less developed uh

play29:47

countries access to health care okay

play29:50

count 36 such as how many doctors there

play29:53

are for every patient

play29:55

okay so that's access to healthcare and

play29:58

of course

play29:58

there'll be more doctors to patients in

play30:01

a

play30:02

medc country risk of disease

play30:06

it calculates the percentage of people

play30:09

with diseases such as aids malaria

play30:13

tuberculosis and obviously again

play30:17

it will be higher in the led seas

play30:19

because of

play30:20

lack of or not

play30:24

actually high quality general eye

play30:26

quality

play30:27

medical care etc and again it affects

play30:30

the quality of life

play30:30

again it affects uh development all

play30:34

right

play30:34

access to education measures this one

play30:37

year measures

play30:38

how many people attend primary school

play30:41

secondary school

play30:43

and higher education and you'll find

play30:46

as you move up the ledc's have a

play30:49

far lower percentage of people attending

play30:52

education whether it's high education

play30:55

secondary school etc

play30:57

compared to the medc so their

play30:59

development is affected

play31:01

because you don't have a proper

play31:02

education you can't get into a proper

play31:04

job

play31:05

you lack necessary skills not that

play31:07

you're not intelligent

play31:08

all right but these are things that

play31:10

effects and development

play31:11

literacy rate the percentage of adults

play31:14

who can read and write

play31:18

you understand and in developed

play31:21

countries

play31:22

because the developments are because

play31:24

almost everyone can read and write it's

play31:25

something 99 or 98 or 99.8

play31:29

right compared to the early and it

play31:31

affects your quality of life it affects

play31:33

your

play31:34

development access to technology

play31:38

includes statistics such as percentage

play31:40

of people have access to phones

play31:43

you understand mobile phones television

play31:47

internet all these things help you

play31:49

whether it's with your studies

play31:51

all right you notice when over that

play31:53

coming those who had internet facilities

play31:56

etc

play31:57

were able to

play32:00

learn online etc okay compared to others

play32:04

and the development was happening

play32:06

and of course it's lower in led sees

play32:10

gender equality compares the statistics

play32:13

such as

play32:14

literacy rate and employment between

play32:16

genders

play32:17

and we find there's a greater gender

play32:20

inequality

play32:21

in ledc's okay compared to the

play32:24

medcs where it's close and not totally

play32:27

there

play32:28

you find women are still being

play32:29

disadvantaged okay

play32:31

but it's closer so there's more

play32:33

development

play32:34

and this shows you social indicators

play32:37

this is

play32:38

these young cute little people here you

play32:41

understand they're very

play32:42

uh adorable but they lack the facilities

play32:46

like ledc countries how much development

play32:50

will they

play32:51

face will they be able to get you

play32:53

understand

play32:54

if they we don't remove them from these

play32:56

conditions

play32:57

you can see from those eyes there's a

play32:59

huge amount of intelligence here

play33:02

beside them looking so cute all right

play33:05

but

play33:05

unfortunately that's what happens okay

play33:08

whereas on the other hand the

play33:11

opportunities

play33:12

are yeah you can see the quality of life

play33:15

is higher

play33:16

strong chance you understand that this

play33:19

young lady is going to get into

play33:21

skills development she's going to move

play33:22

up in life and of course development is

play33:25

greater okay

play33:29

then we come across the human

play33:30

development index i've seen

play33:32

this human development index been called

play33:35

an economic indicator in certain

play33:39

references

play33:40

i've been seeing it called a social

play33:42

indicator

play33:44

you understand what is this

play33:47

the human development index measures

play33:51

the level of human development all right

play33:54

that's what he does it measures

play33:56

now it has three key dimensions

play33:59

the long and healthy life social

play34:03

you understand the access to education

play34:07

and a decent standard of living it's

play34:09

about economic

play34:10

also you understand so i would consider

play34:13

it

play34:13

a mixture of both you understand

play34:17

so it includes social and economic

play34:20

independent

play34:21

indicators and it's more dependable for

play34:24

depend

play34:25

working out level of development you

play34:28

understand

play34:28

because it brings in both factors can

play34:31

you see it

play34:32

right now watch out for this one it

play34:34

ranges from zero to

play34:36

one it works the opposite from the gini

play34:39

coefficient now

play34:40

with zero being the worst quality of

play34:43

life

play34:44

and one being the perfect quality of

play34:46

life

play34:47

can you see all right it's opposite just

play34:50

be careful

play34:50

now look at this learners can you see it

play34:53

brings in the gross

play34:54

national income per capita the money and

play34:58

can you see but it also brings in social

play35:00

issues like health

play35:02

you understand education all right

play35:06

schooling all these things life

play35:08

expectancy

play35:09

so it brings both eh you understand so

play35:12

that's what makes it even more reliable

play35:14

you can get a better indication

play35:16

of course no one will be totally zero or

play35:18

no one will be one

play35:19

okay but mdc's will be more towards one

play35:23

and lots of ledc's will be more towards

play35:26

zero okay and showing development

play35:30

all right let me just go on and my

play35:32

computer then demographic indicators

play35:36

they are demographic indicators of

play35:38

population statistics the figures

play35:41

it's the figures you look or it gives

play35:44

you exact figures

play35:45

in terms of age specific decorates can

play35:48

you see it

play35:49

and they draw graphs you can see less

play35:52

developed

play35:52

countries there's high in terms of that

play35:55

can you see it low

play35:56

but it's all dealing with figures can

play35:58

you see it

play36:00

all across even at a separate 75 plus

play36:03

let's develop the higher end gives you a

play36:05

figure can you see it

play36:07

okay so it actually deals with

play36:08

statistics

play36:10

numbers a social indicator is derived

play36:15

readily from our demographic indicators

play36:17

in fact the economic indicators also

play36:19

because these are statistics but social

play36:22

indicators like

play36:23

population age structures mortality

play36:26

rates

play36:27

sex ratios children women ratios

play36:30

you understand infant mortality rate

play36:32

life expectancy death rate

play36:34

literacy rate it comes from statistics

play36:37

so it's demographic indicators that give

play36:40

you a good idea about

play36:42

these things okay dealing with

play36:45

statistics

play36:46

then of course let's just summarize

play36:48

again because

play36:49

we do need i know you've done more

play36:51

economically developed

play36:54

countries unless but we need to look at

play36:56

it again just to

play36:57

have a review over it so that you

play36:59

haven't forgotten i know you didn't

play37:01

grade 9

play37:02

it's a term referring to a country that

play37:04

is developed

play37:06

or highly industrialized highly

play37:08

industrialized

play37:10

okay lots of technology used tertiary

play37:13

activities factories whatever but it's

play37:16

highly

play37:16

not dependent so much on the primary

play37:19

sector although it's fine sector is

play37:20

important

play37:21

but they process their goods they sell

play37:23

them at higher prices

play37:25

make big money right in which

play37:29

the in the most people

play37:32

have access to health care and education

play37:35

etc

play37:36

most people now we look at the chair

play37:40

it's

play37:40

includes most of europe north america

play37:43

parts of latin america

play37:45

and east asia okay now if we look at

play37:48

this mr brat

play37:50

he actually put a north south divide

play37:53

line

play37:54

and if you look at it carefully you'll

play37:56

notice this is where

play37:58

the medcs are found the more

play38:01

economically developed countries are

play38:03

here

play38:04

and less economically here they may be

play38:07

in between here some countries that are

play38:09

more economically developed etc or newly

play38:12

industrialized countries

play38:14

right but generally this is the trend

play38:16

but mr

play38:17

trump has done shown us in his life so

play38:20

we can say that

play38:21

most of the more economic developed

play38:23

countries are found

play38:24

in the northern hemisphere

play38:28

okay let's go to

play38:31

other concepts less economically

play38:34

developed countries

play38:35

the ledc's okay they are low-income

play38:40

countries

play38:40

confronting severe structural

play38:43

impairments like obstacles impedements

play38:46

means

play38:47

obstacles all right structural it's

play38:49

infrastructure etc

play38:51

all right to sustainable development

play38:55

to maintain the development over a long

play38:57

time

play38:58

they have enough resource using the

play38:59

resources wisely

play39:01

so this left for the future you

play39:04

understand

play39:04

human sustainable development all those

play39:06

things but you find many of these ledc

play39:08

countries

play39:09

are selling their raw materials they're

play39:10

not processing that much

play39:12

of course of various difficulties you

play39:15

understand that they experience

play39:17

lack of proper education uh markets

play39:20

whatever

play39:21

domestically these are problems so

play39:25

these are obstacles they have and

play39:27

they're selling raw materials they're

play39:28

not getting much if you sell processed

play39:30

goods to other countries you're going to

play39:31

get more money

play39:32

right so they are highly vulnerable

play39:36

they're at risk to economic and

play39:39

environmental shocks

play39:41

in terms of economic recession of the

play39:43

world who gets worse

play39:45

is the led seas because they don't have

play39:47

that capital backup

play39:50

whereas if the covert hit you find a

play39:52

people unemployed during that time

play39:55

you understand and or during the covert

play39:57

time

play39:58

america can send off trillions of

play40:00

dollars to support the people

play40:02

but many ledc countries can't they don't

play40:04

have the money

play40:05

you understand okay environmental shocks

play40:09

hurricane hits america they got money

play40:11

they support

play40:12

less tragedies but if it hits

play40:16

places like bangladesh or whatever

play40:19

massive disaster you understand because

play40:22

they don't have the infrastructure and

play40:23

the support

play40:24

so they have generally low levels of

play40:26

human assets

play40:28

okay in terms of people's income

play40:33

their savings whatever you understand

play40:35

and even their skills

play40:37

okay not because they're not intelligent

play40:39

but they haven't been given the

play40:41

opportunities

play40:42

okay and includes most countries in

play40:45

africa

play40:45

indian subcontinent parts of latin

play40:48

america

play40:49

right lots of them are in the sun

play40:51

hemosphere

play40:53

okay not all of them because the indian

play40:55

subcontinent

play40:56

is in the northerns but lots of them are

play40:58

in the southern hemisphere

play41:00

now we do need to know the point

play41:03

learners

play41:04

we can't just have led seas and medcs

play41:07

we also have nic's

play41:11

newly industrialized countries

play41:15

newly industrialized because what

play41:17

happens here

play41:18

these are countries who economies have

play41:21

not reached the medc

play41:23

they're not in the more economically

play41:25

developed but they have

play41:27

gone above the ledc stage

play41:30

that means they've gone above the less

play41:32

economically developed

play41:33

they are places like china brazil mexico

play41:37

south africa malaysia

play41:41

i think i like china they're twice all

play41:44

right

play41:44

india thailand philippines turkey

play41:48

many countries let's look at this let's

play41:51

look at china

play41:53

and in people employed you'll notice

play41:56

most of them are employed in the primary

play41:58

sector

play41:59

74 percent tertiary sector

play42:03

15 can you see so it's mostly dealing

play42:06

with

play42:07

extraction raw materials not much

play42:10

processing etc or technology to use

play42:14

okay that's clearly an ledc let's look

play42:18

at the uk

play42:19

tertiary 79 compared to 15.

play42:23

all right primary labor or employment

play42:27

3 compared to 74.

play42:30

can you see doesn't mean they're

play42:32

producing less agricultural products

play42:34

but what we see here is

play42:37

that they highly industrialize using

play42:40

technology

play42:41

etc so they can even produce more food

play42:43

than they need

play42:44

because using all the different

play42:45

harvesters the machinery this is clear

play42:48

cut

play42:48

but let's take malaysia

play42:52

is malaysia same as this no tertiary

play42:55

activities is 45 percent yeah it's 15.

play42:59

primary subjects is 15

play43:02

yeah it's 74. so malaysia is not like

play43:06

kenya

play43:07

on the other hand tertiary is 45

play43:10

uk is 79.

play43:13

primary is 15 uk is 3.

play43:18

so they not at the most

play43:21

more economically developed countries

play43:23

they sort of in between

play43:25

heading towards the medcs and this is

play43:28

what we call

play43:30

the newly industrialized countries

play43:33

they're coming for places like china

play43:36

india as i said

play43:37

big money earners in terms of

play43:40

uh gdp etc so they're moving forward

play43:44

you understand okay so that explains

play43:48

that right

play43:49

now there's some here i'm just using two

play43:52

united kingdom can you see that's your

play43:56

medc

play43:57

bangladesh that's your ledc

play44:00

all right look at the per capita income

play44:03

learners

play44:04

from the united kingdom the per capita

play44:07

gnp

play44:09

you understand is 35 000

play44:12

bangladesh 1600

play44:16

massive difference literacy rate 99

play44:19

in the united kingdom bangladesh 47

play44:24

massive all right infant mortality rate

play44:27

five per thousand in the united kingdom

play44:30

look at bangladesh 58 000

play44:34

lack of healthcare or proper healthcare

play44:37

for

play44:38

all you understand they still will have

play44:40

private hospitals there

play44:41

but many people won't have those

play44:43

facilities of top quality

play44:45

hospitals etc but doctor look at this

play44:48

2.2 per thousand

play44:50

zero point two six percent uh

play44:53

doctors rather the thousand newspapers

play44:56

rate

play44:57

332 per thousand six

play45:00

per thousand for bangladesh can you see

play45:02

the difference tv ownership

play45:04

one thousand one hundred per thousand

play45:06

means that some families have two tvs or

play45:09

more

play45:09

you only said look at this seven per

play45:12

thousand

play45:13

so we talk about just a tv imagine the

play45:15

internet facilities etc there's massive

play45:18

differences

play45:19

and it affects development life

play45:22

expectancy 79 in uk

play45:25

60 in bangladesh

play45:28

look at this people employed all right

play45:32

in the uh primary uh in farming

play45:36

right in the farming 1.2

play45:40

okay in farming right now look at here

play45:44

45 so

play45:47

just let alone the farming only we have

play45:50

45 percent involved it just gives you an

play45:53

idea

play45:54

how development will be affected all

play45:56

right if we look at these

play45:58

uh statistics that you were given to us

play46:01

here

play46:02

all right it's a massive massive

play46:04

difference learners i thought i'd bring

play46:06

that to your

play46:07

attention now obviously

play46:10

we have to do a little activity all

play46:13

right just a simple one

play46:14

just for us to reflect on what we did

play46:17

for this lesson

play46:19

okay let's look at what's given to us

play46:22

they gave us three countries

play46:24

all right kuwait bolivia and bangladesh

play46:28

and he gave us statistics per capita

play46:31

is 1886.

play46:35

all right in terms of dollars olivia 757

play46:40

bangladesh 145 massive difference say

play46:44

correct massive difference you can

play46:46

already start looking at it what it say

play46:48

kuwait medc bangladesh

play46:51

ledc birth rate 2036

play46:56

40. not much of a difference all right

play46:59

i think they're like for making babies

play47:00

in kuwait also

play47:02

percentage living or in the urban areas

play47:05

58

play47:06

bangladesh 11 massive difference

play47:11

life expectancy going 69 bangladesh 47

play47:16

massive difference right agriculture

play47:20

percentage

play47:21

17 in percent in agriculture

play47:24

71 for bangladesh i'm just using these

play47:28

two

play47:28

as an example all right because i i like

play47:30

the questions on them

play47:32

right differentiate first question says

play47:34

differentiate between the concepts

play47:36

development and development indicators

play47:40

let us just be careful right if it says

play47:42

differentiate

play47:43

all right i just took the one straight

play47:45

from the nodes to illustrate something

play47:47

to you

play47:48

okay let me get my face moved a little

play47:51

bit all right

play47:52

development is a process of change that

play47:55

affects people's lives

play47:58

okay and it may involve the improvement

play48:00

quality but if you have this

play48:02

it is fine all right now watch a word

play48:05

whereas because you want a

play48:08

differentiation

play48:10

development indicators measure the level

play48:13

of development

play48:15

to a country's economic and social

play48:18

and institutional growth can you see it

play48:21

i must have that way as

play48:23

thing all right must must have it

play48:26

because it's showing a comparison

play48:28

don't do them separately maybe the

play48:30

markers will give you

play48:31

but why take a chance learners show a

play48:33

comparison

play48:35

okay that's what i want to demonstrate

play48:37

to you yeah

play48:39

state two importances of measuring

play48:41

development

play48:42

straight from the notes learners can you

play48:45

see

play48:46

it shows you the level of development it

play48:48

shows you areas

play48:50

uh or challenges that i experience in

play48:52

which

play48:53

areas when you look at development

play48:55

indicators

play48:56

and it also allows you to look at

play48:58

strategies

play48:59

then why is that area low you start

play49:01

investigating

play49:02

there's so many taken straight from the

play49:04

nodes identify

play49:06

an economic and social indicator

play49:10

right we can see economic gdp

play49:14

can you see is there a social indicator

play49:18

birth rate a thousand all right

play49:22

life expectancy

play49:25

economic telling you how many people are

play49:28

involved in agriculture

play49:29

all right can you see any two all right

play49:33

classified kuwait and bangladesh as

play49:36

either more economically developed or

play49:39

less economically developed

play49:41

right and there again you know kuwait

play49:44

more economically than bangladesh less

play49:48

economically developed give reasons you

play49:51

can use anything

play49:53

social or economic you can see the gdp

play49:57

or gnp per capita for bangladesh is 18

play50:00

086

play50:01

and for bangladesh for kuwait and for

play50:04

bangladesh is 145.

play50:06

bangladesh is much lower involved in

play50:08

agriculture you can say

play50:10

kuwait 17 bangladesh 71

play50:14

can you see it all right life expectancy

play50:17

for bangladesh for kuwait is 69

play50:20

bangladesh is much lower

play50:21

47. can you see that's what you give

play50:24

okay

play50:24

give reasons for your answers to

play50:27

question four

play50:29

i've got one more here a positive social

play50:32

indicators

play50:33

results in good development explain this

play50:36

all right of course we're looking at the

play50:39

quality

play50:40

of life and the productivity of the

play50:42

people

play50:44

so when i talk about positive social

play50:45

indicators if they

play50:47

good you understand like for instance

play50:50

gnp

play50:50

per capita is high the life expectancy

play50:53

is good

play50:54

you understand or even the literacy rate

play50:58

is good

play50:58

you understand which tells you they have

play51:00

lots of skills

play51:02

okay and they're living a better quality

play51:04

of life

play51:05

therefore they'll be more productive

play51:07

there'll be more technology

play51:09

there'll be more technology in

play51:11

industrial areas

play51:12

there'll be a higher level of

play51:14

industrialization with all the skills

play51:16

resulting in good development

play51:20

can you see how we relate those things

play51:23

and please

play51:25

you must go well in this remember it's

play51:28

about applying your work

play51:29

all the notes will be there different

play51:31

resources will pop up

play51:33

like i've used different resources in

play51:35

this to give you examples

play51:37

so you should be able to understand and

play51:39

interpret

play51:41

them all right lettuce

play51:45

i hope you enjoyed the lesson all the

play51:48

best

play52:00

goodbye

Rate This

5.0 / 5 (0 votes)

Related Tags
DevelopmentGeographyGrade 11Economic IndicatorsSocial IndicatorsEducationQuality of LifeGDPHDIGini Coefficient