My Secret To Having A Strong Bias - Inverse FVG's
Summary
TLDRThis video tutorial delves into the concept of inverse fair value gaps, a trading strategy used to identify market trends. It explains the basics of fair value gaps and then contrasts them with inverse fair value gaps, which occur when a gap is breached and subsequently acts as support or resistance. The presenter uses real-time chart examples to demonstrate how these gaps can provide a bias for future price movements and help traders understand potential draw on liquidity. The video is a valuable resource for traders seeking to refine their strategies and gain confidence in market analysis.
Takeaways
- 🔍 The video focuses on explaining inverse fair value gaps in trading.
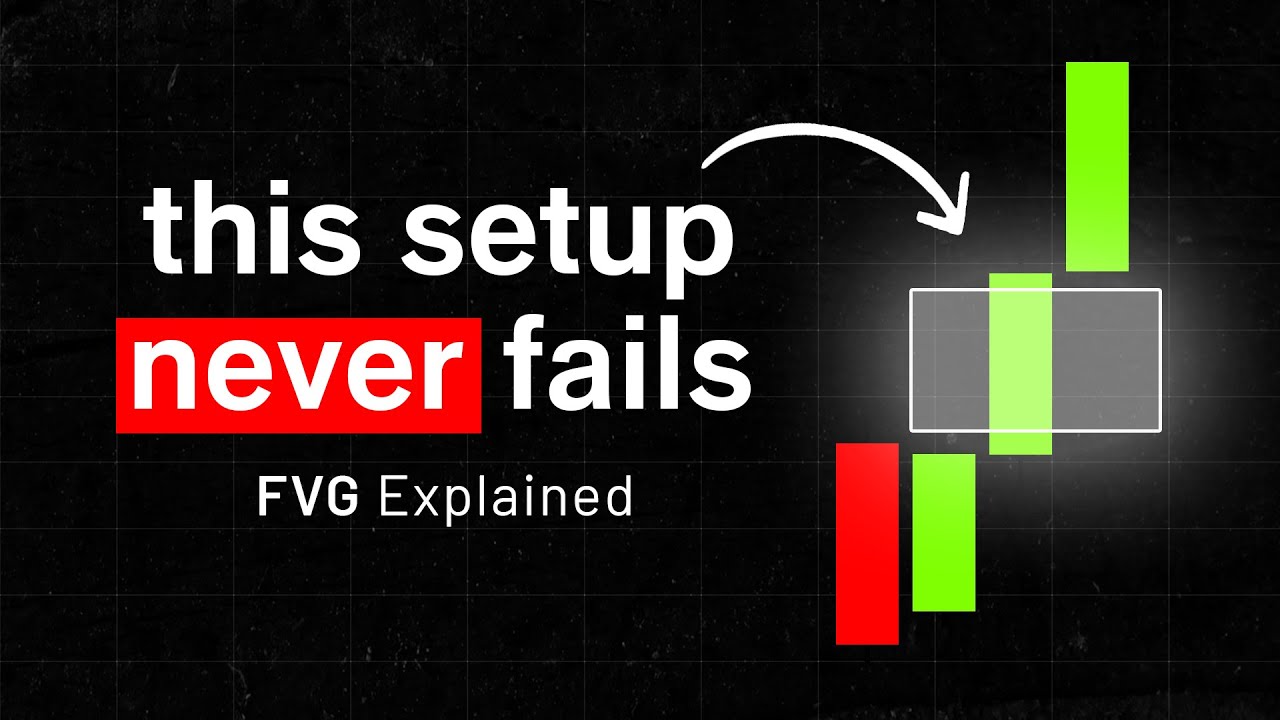
- 📊 Fair value gaps are typically identified within a three-candle structure in candlestick charts.
- 📉 An inverse fair value gap occurs when a fair value gap is broken through and then acts as support or resistance.
- 🔄 The inverse fair value gap behaves similarly to how resistance can turn into support and vice versa.
- 💡 The concept is used to understand potential support levels once a fair value gap is violated.
- 📝 Examples of inverse fair value gaps are provided to illustrate how they can indicate market direction and bias.
- 📈 These gaps help traders identify the likely direction of price movement by showing which gaps are respected or disrespected.
- 🛠 Traders can use inverse fair value gaps to determine strong biases and anticipate future price actions.
- 👀 Observing these gaps across different time frames (e.g., 5-minute, 15-minute charts) is crucial for accurate analysis.
- 🤔 The video encourages viewers to incorporate inverse fair value gaps into their trading strategies for better decision-making.
Q & A
What is a Fair Value Gap (FVG) in trading?
-A Fair Value Gap is a three-candle structure in trading where a gap is created between the wicks of the first and third candles, representing an imbalance or inefficiency in the market.
How is an Inverse Fair Value Gap different from a regular Fair Value Gap?
-An Inverse Fair Value Gap occurs when a regular Fair Value Gap is broken through and then acts as support or resistance, depending on the direction of the breakout.
What is the significance of a Fair Value Gap in technical analysis?
-Fair Value Gaps indicate areas of potential support or resistance and can signal future price movements when the gap is respected or disrespected by the market.
How can traders use Inverse Fair Value Gaps to their advantage?
-Traders can use Inverse Fair Value Gaps to gauge market strength and bias. If a Fair Value Gap is broken and then holds as support or resistance, it can indicate the direction of future price movements.
What does it mean when a Fair Value Gap 'disrespects' a level?
-When a Fair Value Gap disrespects a level, it means that the price breaks through the gap without holding it as support or resistance, indicating a potential shift in market direction.
Why is it important to consider both bullish and bearish Fair Value Gaps?
-Considering both bullish and bearish Fair Value Gaps helps traders understand market sentiment and potential reversal points, enhancing their trading strategy and bias.
How do traders determine if a Fair Value Gap will act as support or resistance?
-Traders observe price action around the Fair Value Gap. If the price breaks through and holds above the gap, it acts as support; if it holds below, it acts as resistance.
What role does market structure play in analyzing Fair Value Gaps?
-Market structure helps traders identify key levels and potential reversals. Observing Fair Value Gaps within the context of market structure provides insights into price direction and strength.
Can you provide an example of how an Inverse Fair Value Gap is used in a real trading scenario?
-In a bearish scenario, if a bearish Fair Value Gap is broken and the price comes back to hold it as support, traders may use this as a confirmation to enter a long position, expecting higher prices.
What is the main takeaway from understanding and using Inverse Fair Value Gaps in trading?
-The main takeaway is that Inverse Fair Value Gaps help traders build confidence in their market bias and trading strategy by indicating areas of support and resistance, aiding in the prediction of future price movements.
Outlines
📈 Introduction to Inverse Fair Value Gaps
This paragraph introduces the concept of inverse fair value gaps, a trading strategy tool that the speaker will explain in the video. It begins by defining a regular fair value gap, which is a three-candle formation with a gap between the high of one candle and the low of the next. The inverse fair value gap is then described as a situation where the market breaks through a regular fair value gap and then returns to it, where it acts as support or resistance, depending on the market direction. The speaker aims to clarify how to use this tool for trading bias and understanding market movements.
📉 Using Inverse Fair Value Gaps for Trading Bias
The speaker discusses how to use inverse fair value gaps to determine market bias. They provide examples from trading charts, explaining how breaking through a bearish fair value gap and then seeing it act as support can indicate a potential upward movement. The paragraph emphasizes the importance of observing how the market respects or disrespects these gaps, which can provide insights into future price action. The speaker also uses specific chart examples to illustrate how to identify and utilize inverse fair value gaps in trading scenarios.
💡 Advanced Strategies with Inverse Fair Value Gaps
In this paragraph, the speaker delves deeper into the use of inverse fair value gaps, focusing on how they can be used to identify potential draw and liquidity levels in the market. They explain that by observing which fair value gaps are respected or disrespected, traders can gain a better understanding of market strength and weakness. The speaker provides several examples to demonstrate how to apply this knowledge in different trading situations, ultimately aiming to enhance trading strategy and confidence.
Mindmap
Keywords
💡Inverse Fair Value Gap
💡Fair Value Gap
💡Candle Structure
💡Support and Resistance
💡Market Structure Shift
💡Bias
💡Liquidity
💡Break and Hold
💡Doji Candle
💡Reversal
💡Disrespect
Highlights
Introduction to the concept of inverse fair value gaps and their use in trading.
Explanation of what a regular fair value gap is and its three-candle structure.
The definition of an inverse fair value gap as a regular gap that gets broken through and acts as support or resistance.
The use of inverse fair value gaps to determine market bias and potential price direction.
How to identify a fair value gap on a chart and its potential to switch from resistance to support.
Examples of using inverse fair value gaps on ES and NQ charts to understand market structure shifts.
The importance of observing how price reacts when it revisits an inverse fair value gap.
Strategies for using inverse fair value gaps to confirm a bearish or bullish bias in trading.
The application of inverse fair value gaps in conjunction with market structure shifts for trading decisions.
How to use inverse fair value gaps to identify potential entry points in the market.
Transcripts
all right welcome guys to another video
a new video today we are going to be
going over inverse fair value gaps just
another one that's been requested now
we've done videos in the past on Fair
Value gaps but not a lot of people know
maybe what an inverse fair value Gap how
to use an inverse variable eye Gap how
do I specifically use inverse feral eye
gaps so that's what we're going to be
going talking over today and the first
thing I just want to want to start over
is you know just the basics right so
exactly you know what is a regular you
know fair value Gap first so looking at
you know candle structure candle
formation we know right that a fair
value Gap is a three candle structure so
what does it look like
we have you know a candle here
and then we have
you know another candle here
right
and then we have another candle here
you can see
the body right
this is our Fair like effort what a fair
bike up would look like right we have
three candle formation right to the
downside one two three and we have a gap
here created
that is our fair value Gap or what would
be considered you know our fair value
Gap so we take the previous Wick right
to the next Wick and this now becomes
Our Fair Value Gap right it's the body
of you know this candle formation so now
what is an inverse trivia Gap well in
inverse for Value Gap is just a regular
fair value Gap that gets broken through
and then comes back to to add support or
add resistance so if we had you know a
bearish fair value Gap like this what an
inverse for Value Gap would be is you
know let's say a regular fair value Gap
would be you know we'd come up into this
and then reject and come back lower but
let's say we actually disrespect this
free value Gap end up breaking through
it right
so now an inverse verbi Gap is once we
break through the sphere value Gap we
would want to see it now hold and act as
support so a lot of the times pass for
Value gaps will then switch by it or you
know switch just like you know
resistance turn support support can turn
resistance it's the same thing with a
fair value Gap right so once we break
through this password value Gap this is
now going to act as an inverse private
act and going to act as support when we
come back into it and then possibly go
look to see higher so again inverse for
Value Gap just a regular for Value but
used once we break through it right in
the opposite direction we now want to
see that fair value Gap hold and you
know so you know show some sort of
strength right so looking at the charts
now let's see if we can find some
examples and actually how do I use them
to my bias right A lot of the times what
I use inverse previews for is it
actually gives me a good bias and
understanding of where price wants to go
next for example looking at today on ES
going going down to the five minute
we can see that we had you know clear
cells out here we can see all these lows
we have one two three four five you know
five low stacked here right this is a
clear cell side level acting right
actually wait I think it was on NQ let
me pull up NQ NQ pretty similar here as
well
and cue a little bit more uh clear to
understand right we have
clear buy side level we have two equal
highs up here ends up getting swept we
have Market structure shift and then
looking at the 15 minute you can see let
me get past all these old drawings off
so he doesn't mix up
you can see we had break a structure and
then we had this 15 minute fair value
Gap here that we ended up coming back
into and then rejecting to go back lower
you can see what came up and that ended
up selling off from fomc so how do I use
an inverse for by Gap what would
possibly be an example of one well let's
look at the five minute here well you
can see
looking at this chart here
we have you know a big move to the
upside now once we sweep this level here
what am I now I'm not bullish anymore
I'm bearish right once we sweep this
biased level again looking at a bigger
time frame like the 15 minute once we
sweep this you know battle side level
what do I think is the drawing liquidity
the next round liquidity obviously
becomes whatever that next low is so
this now becomes the draw on liquidity I
called this live when we were you know
with the team I said the Drone liquidity
is going to be you know this low after
seeing you the structure we've been
playing out but how can I use an inverse
inverse for Value Gap to give me a sort
of an even more strong bias going
towards you know something like this so
let's go down to the five minute so if I
am bearish now right when this holds and
I'm bearish I want to see some sort of
bullish fair value Gap show disrespect I
don't want to see us respect a bullish
preview so if we're looking at the five
minute we can see right we have you know
this fair value Gap here and we have you
know this fair value Gap here so if I'm
bearish I don't want to see us continue
to respect these levels so looking at
this very I got by draw this in you can
see we come down and we end up holding
it right we're still respecting it
notice we end up breaking through it
once we break through this this now
gives me an a more confident short bias
knowing we could possibly go lower right
this tied in with our Market structure
shift right if we're looking at the five
minute we don't have any marks or shift
nothing yet until we sweep this low
notice this was the first low that we
actually was broken after sweeping by
side that we actually got you know big
displacement and then we had to pull
back to this Fair Valley Gap right here
right but once we broke through this 15
minute free value Gap that gave us a
little bit more confidence to possibly
see lower now if we're looking at this
chart as well we can see we had a 15
minute for Value Gap
we have a 15 minute provide up here what
do I want to see if we're bearish I
don't want to see us respect this I want
to see us break through it so notice do
we continue to hold this bounce up
bounce up bounce up and we continue to
hold this here what do I want to see if
I'm bearish I want to see a break of
this right notice I would not have taken
a short here quite well actually I would
have taken a short because we have a uh
you know clear Market structure shift
pull back to fair value Gap but if I'm
bearish I want to see these bullish fear
like apps get disrespected and then
possibly look to see how they're going
to react once they get touched off of
right so let's look at some more
examples here so looking at the same
chart here right now once we come down
and we sweep this level here we bounce
off this one hour fair value Gap what do
I now want to see I want to see internal
breaker structure and I want to see you
know I want to see some sort of brake
structure in some sort of displacement
right so that's what we get down here we
can see we got breaker structure good
displacement we have a fair value Gap
right that could be a possible entry
another possible entry could be right
here in this River I got now I actually
wanted to take a long I was looking to
get in here ended up not missing it but
notice the inverse for Value Gap that we
have on a bigger time frame like this
five minute we have this massive fair
value Gap that we actually created from
fomc what do I want to see this now I
want to see this now act as support to
go to buy side notice I draw this in as
well as looking at we have a 15 minute
Gap as well lined these are the areas
that you will see be respected the most
this is a perfect formation of a
reversal notice
this is right here what you want to
watch big move down doji candle
inversion candle big move back up notice
we have a fair value gap on both sides
right here we have an inverse fair value
up here and we have a bullish for Value
Gap right here in the exact same area
this is going to be an area that you're
going to see get respected a lot
especially because you have a bullish
fair value Gap and an inverse for Value
Gap so these are the areas that we want
to see get respected a lot notice
similar area right here we have that one
hour or that one minute past Fair Valley
Gap we pull it over we come back into
this and you can see how much we respect
this inverse for Value Gap once we break
above it so
what's another way that I use this
well the way that I like to think about
inverse for Value gaps is this
let's say on the 15 minute today we come
down and notice we actually never swept
this low down here but we swept this low
and we swept this low so I'm in the back
of my head thinking okay you know what
maybe we're still bearish we possibly
could go back down to sweep South Side
what's going to give me confidence that
buy side is now the Drone liquidity and
not sell side
well if we can break through this big
bearish fair value Gap and then end up
holding the inverse free value Gap
that's going to give me confidence that
the draw on liquidity is higher so going
down to the one minute we have this big
fair value Gap here notice if I was to
draw on right here right and I can see
okay we have this big fair value Gap but
we sweeps we swept internal cells out
but we didn't sweep external you know I
would want to see if I'm bearish I want
to see us hold this but once we break
above this right and we break above this
with volume
I start to get more of a bullish bias my
my draw in liquidity is now going to be
that previous high so I want to see us
continue to respect this inverse free VI
Gap and once we do continue to hold this
the draw on liquidity then becomes
higher in my bias and in my opinion and
this is a great way that I use
inverse-free value gaps to understand
what the potential draw on liquidity is
so here's another example right just
looking at this chart right here you can
see how many inverse for Value gaps
actually end up playing out so we
actually start bearish right and we have
you know kind of a bearish fair value
Gap right here notice once we come back
up to this I would want to see this you
know get respected back to the downside
once I see that this actually comes back
up what would I want to see happen when
we revisit this for Value Gap I want to
see this now act as support notice once
we break through this bearish fair value
Gap with strong volume we then end up
retracing again of course back to
Discount right we go back to Discount
and end up respecting that past fair
value Gap and then end up seeing new
highs back to where we were before right
so there's a lot of times where we can
use inverse for Value gaps here's
another one
right here once we get this initial
bounce again if I'm bearish I want to
see this get respected but I'm not
bearish because we just ended up
bouncing on this inverse for Value Gap
I'm bullish so if I'm bullish I want to
see all of these bearish for Value gaps
get disrespected I want to see as I want
to see them get just absolutely ran
through and then when we come back to it
I want to see them act as support notice
we come up break through this bearish
fair value Gap and then it acts as
support for now in this bullish fear
backup as well and then we and then we
go see higher a lot of different ways
that you could use inverse for Value
gaps notice here we have a bearish fair
value Gap when I see up I'd want to see
it get respected right when it doesn't
get respected look where we come back to
and look where we bounce come to the
right go right back to this inverse free
value Gap right when we broke through it
end up supporting it there's a lot of
ways that you can use this right the
best way I like to use it is as my bias
if I can't seem to understand what the
draw and liquidity is look what fair
value gaps are getting respected and
which ones are getting disrespected are
bullish for Black Ops getting respected
are bearish for Value cups getting
respected and our inverse forever I got
showing strength and in what direction
are they showing strength right
here's another example of an inverse
survey Gap right we have clear buy side
up here once we get this big drop to the
downside I would I would look to see if
this fair value Gap is going to be
respected towards the downside right
notice we end up coming up and we end up
breaking through this what do we now
want to see this as we want to see this
now act as support to Target whatever
that buy side level is right so you can
see right when we end up disrespecting
this we break through this fair value
Gap I want to now see us come back to
this show support show respect to this
level and then go towards whatever that
draw and liquidity is that we'd you know
be expecting for the specific example
it'd be that previous high right so we
break through this big volume come back
into this inverse free value Gap end up
getting bought back up targeting that
buy side level now right when this buy
side levels hit now what am I I'm
bearish so I want to see all these
bullish fair value gaps get disrespected
notice same thing I draw in bearish for
value or a bullish verb I got notice I'm
not worried about this because
liquidity's been swept once we break
through this that gives me confirmation
we probably want to go lower notice what
happens when we come back to this level
perfectly to the tick to the tick one
two and then ends up selling right back
off towards Lowe's right inverse for leg
UPS such a powerful tool let's look at
some more here's another example right
so we have kind of a clear downtrend
here again bigger time frame we have
kind of a clear downtrend now we have a
resting by or sell side right we have
kind of relative equal lows here now
what would I look to see if I'm bearish
well I want to see you know bearish for
like apps get respected and I want to
see bullish for bike UPS get
disrespected well I can see we kind of
have some bearish for bike apps up here
notice we come up we've been rejecting
this right we kind of have internal
break of structure but notice we have
kind of these this big bullish for Value
Gap now well what would I want to see
happen I don't want to see this right
notice we come down continue to respect
this bounce up one more time respect the
bearish fair value Gap right so that's
kind of giving me an understanding we're
in this range buy side up here sell side
up here what do I think is the drawn
liquidity notice what fair value gaps
are getting respected which ones are
getting disrespected bearish for
everybody Gap getting respected many
times one two three continuing to reject
look how we come down and we stop
respecting this inverse for Valley Gap
anymore what can I expect I can expect
for us to come back to this fair value
Gap respect it and then meet sell side
Notice come up we respect this bearish
Fair Valley Gap once we break through
this bullish fair value Gap we stop
respecting this fair value Gap we end up
bouncing right back to it respect it
acts as resistance now acts as
resistance and then we end up selling
off sweeping out that sell side level
that we had down there
so there's a lot of ways you can use
inverse fair value gaps a lot of it just
takes experience right the best way I
like to use it and I think what is most
valuable that people don't really use
them for is recognizing strength and
weakness and giving you a better sense
of what the draw on liquidity is going
to be using them in context like this is
going to be super helpful building
confidence on what you think the draw is
and overall just building confidence in
your trading strategy in general so let
me know if this video helped you guys in
any way let me know if you're going to
start using these in your trading
strategy and be hyped for more videos to
come so leave a comment make sure to
subscribe make sure you like the video
and I'll see you guys in the next one
peace
5.0 / 5 (0 votes)