Cartas de Controle (Aula 01) - Introdução ao Gráfico X-Barra / R
Summary
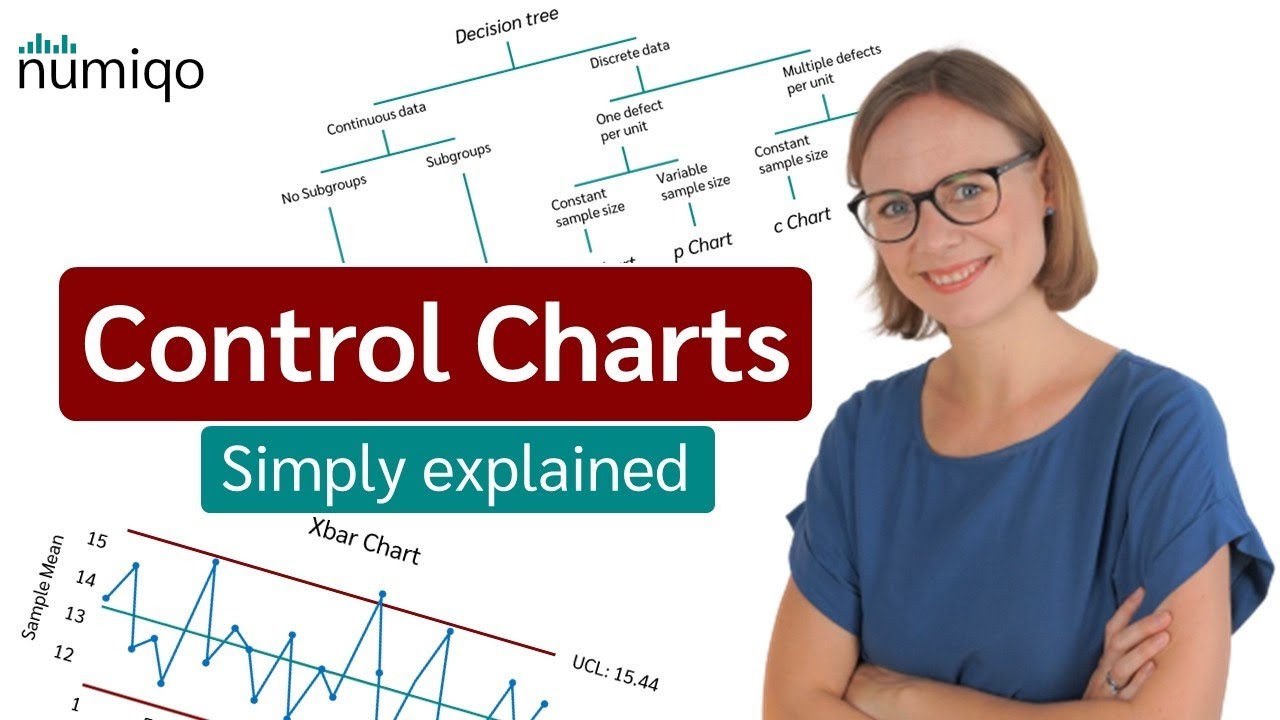
TLDRThis video provides an in-depth introduction to control charts, specifically focusing on X-bar and R charts. It explains the concept of statistical control, emphasizing the importance of monitoring process stability. The video covers how control charts are used to track variables like weight, volume, and thickness, and how to interpret the results. The process of calculating control limits and understanding whether a process is under statistical control is explained step-by-step, along with practical examples. The presenter also clarifies common misconceptions and outlines the purpose of these tools in quality control management.
Takeaways
- 😀 Control charts (gráficos de controle) are quality tools used to monitor whether a process is under statistical control.
- 😀 A process is under statistical control if it remains stable over time, following the same probability distribution.
- 😀 Control charts are not for setting goals or specifications; they reflect the process behavior based on historical data.
- 😀 The X-bar R chart consists of two graphs: the X-bar graph (for averages) and the R graph (for ranges or amplitudes).
- 😀 The X-bar chart evaluates the means of sample groups over time, while the R chart looks at the spread (range) of values within those samples.
- 😀 Statistical control means that the process shows predictable, consistent results, with no significant changes in the mean or standard deviation over time.
- 😀 When a data point falls outside the control limits, it signals that the process may be out of statistical control, warranting further investigation.
- 😀 The control limits for the X-bar chart are calculated using the process mean and standard deviation, derived from sample data.
- 😀 The R-bar (average range) and the size of the sample (n) are key factors in calculating the control limits for the R chart.
- 😀 If the R chart shows values within control limits, it indicates that the variability in the process remains consistent, meaning the process is stable.
- 😀 A control chart does not tell you whether the process meets specifications or targets, only if the process itself is stable or not.
- 😀 If a process exhibits instability, it means that it may follow different probability distributions at different times, making future outcomes hard to predict.
Q & A
What are control charts, and why are they important in quality management?
-Control charts are a quality management tool used to monitor whether a process is under statistical control. They help identify whether the variability in the process is consistent over time or if it is affected by special causes, enabling better decision-making in process improvement.
What does it mean for a process to be 'under statistical control'?
-A process under statistical control is one where the process's variability is stable over time, following a consistent distribution (e.g., normal distribution). This means that the process's mean and standard deviation do not change significantly, making future outcomes more predictable.
What is the difference between control limits and specification limits in control charts?
-Control limits represent the boundaries within which the process is expected to operate if it is under statistical control. They reflect the natural variability of the process. Specification limits, on the other hand, define the acceptable range of values for the product or process, often based on customer requirements.
What is the purpose of the X-bar and R control charts?
-The X-bar and R control charts are used together to monitor both the average (X-bar) and the range (R) of sample data over time. The X-bar chart tracks the mean of each sample, while the R chart tracks the variability (range) within each sample.
What are some examples of variables that can be monitored using control charts?
-Examples of variables that can be monitored include product weight, volume, thickness, tensile strength, and the concentration of elements in mixtures.
What does it mean when a point falls outside the control limits on a control chart?
-When a point falls outside the control limits, it indicates that the process may be out of control, suggesting that some special cause is affecting the process. This could mean that the process is no longer stable and needs investigation.
How are the control limits for the X-bar and R charts calculated?
-The control limits for the X-bar chart are calculated using the process's mean and estimated standard deviation, along with the sample size. For the R chart, control limits are calculated based on the average range (R-bar) and sample size, with constants taken from tables.
What is the significance of the R-bar in the R chart?
-The R-bar represents the average range of a sample, which measures the variation within each sample. It is used to estimate the process's standard deviation and calculate the control limits for the R chart.
Why is it important to differentiate between process control and product specification in quality control?
-Differentiating between process control and product specification is crucial because control charts help monitor the stability and predictability of a process, while product specifications focus on whether the final product meets customer requirements. They serve different purposes in quality management.
What should be done if points on a control chart fall outside the control limits?
-If points fall outside the control limits, it indicates that the process may be out of control. The next steps involve investigating the causes of the variation, correcting the process, and re-establishing statistical control. Further videos in the series will explain the actions to take in these situations.
Outlines

This section is available to paid users only. Please upgrade to access this part.
Upgrade NowMindmap

This section is available to paid users only. Please upgrade to access this part.
Upgrade NowKeywords

This section is available to paid users only. Please upgrade to access this part.
Upgrade NowHighlights

This section is available to paid users only. Please upgrade to access this part.
Upgrade NowTranscripts

This section is available to paid users only. Please upgrade to access this part.
Upgrade NowBrowse More Related Video
Control Charts simply explained - Statistical process control - Xbar-R Chart, I-MR Chart,...

Statistical Process Control (SPC) in Quality Management + How to create Control Charts
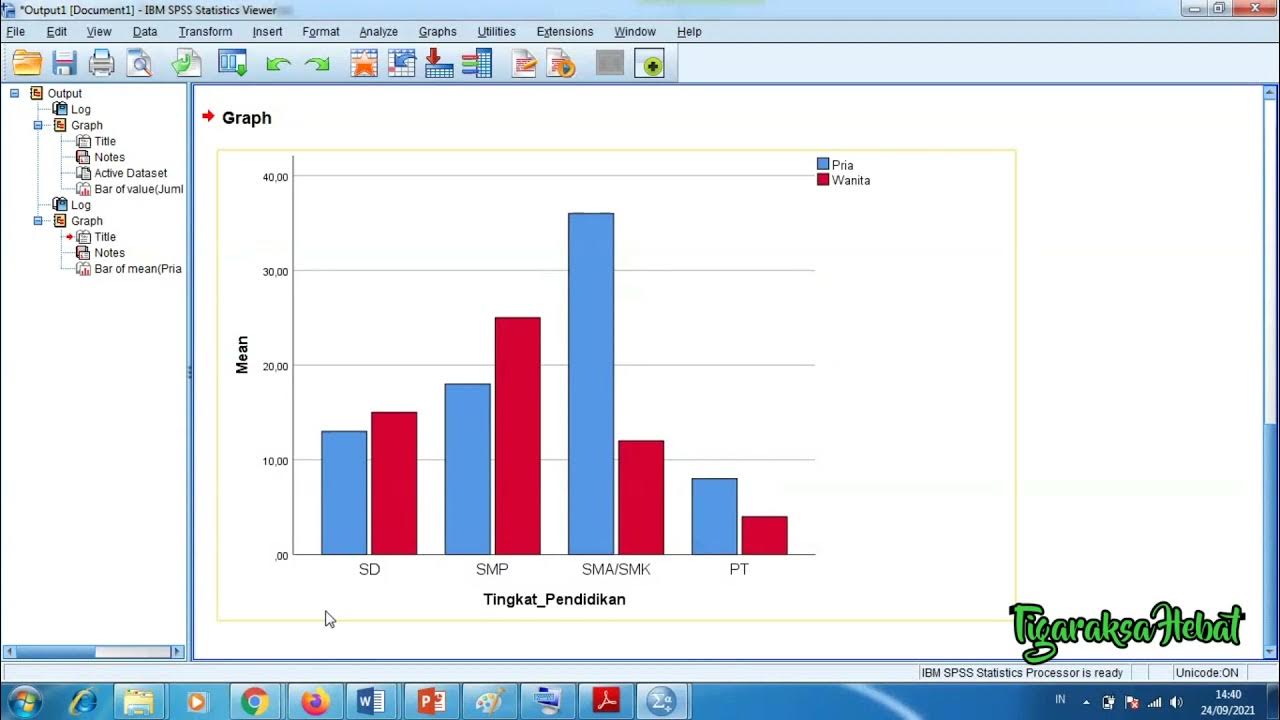
Penyajian Data Statistik Menggunakan SPSS
KONSEP DASAR STATISTIKA DAN DISTRIBUSI FREKUENSI
STATISTIKA (MEAN,MEDIAN,MODUS DAN STATISTK LIMA SERANGKAI)

Statistika 06 | Visualisasi Data dalam Statistika | Data Visualization | Belajar Statistika
5.0 / 5 (0 votes)