Volume Profile
Summary
TLDRThe video introduces the Volume Profile tool, a powerful trading indicator that helps identify key price levels with significant trading activity. Developed in the 1990s, it displays volume across specific price ranges instead of traditional volume analysis. The tool highlights important areas like POC (Point of Control), VAL (Value Area Low), and VAH (Value Area High), assisting traders in pinpointing support, resistance, and reversal zones. By integrating Volume Profile with tools like Fibonacci and WOF, traders can enhance their strategies and improve trade accuracy, making it an essential tool for analyzing market trends and making informed decisions.
Takeaways
- 😀 The Volume Profile tool is an essential tool for advanced traders, allowing them to analyze price levels with high volumes of orders.
- 😀 The tool was created in the 1990s based on concepts from W.D. Gann, a famous trader from Wall Street.
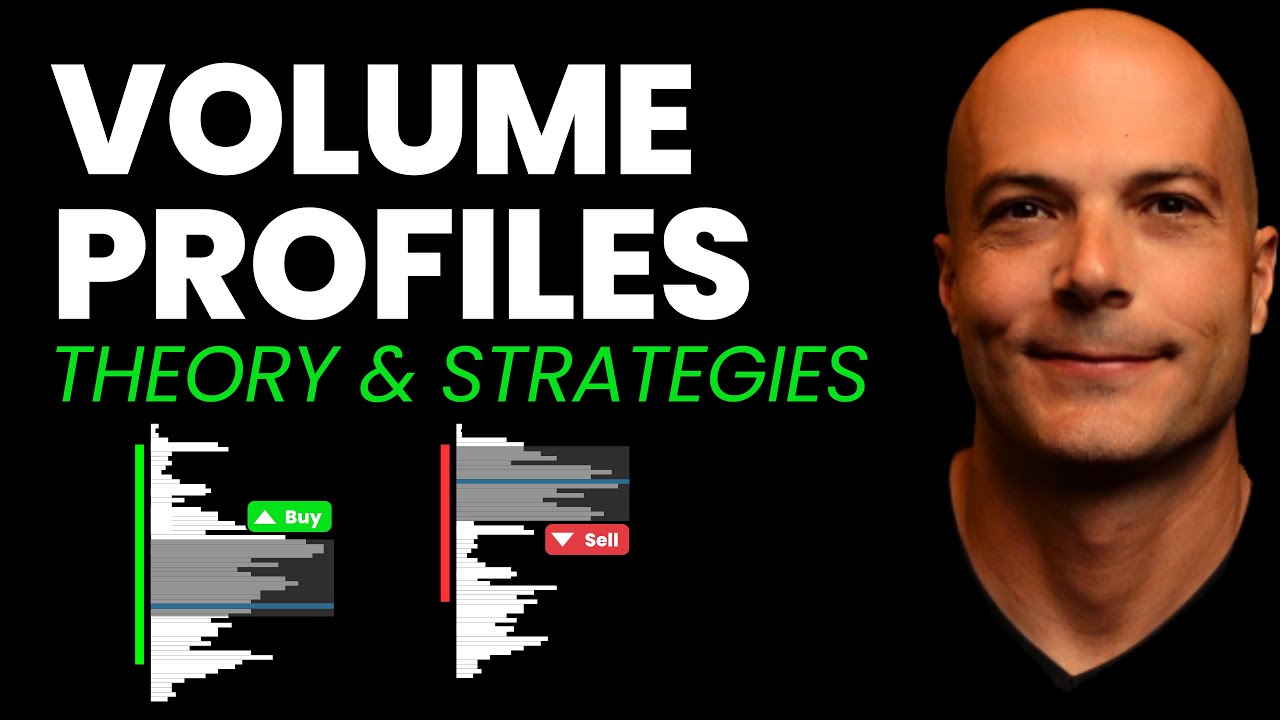
- 😀 Volume Profile differs from traditional volume analysis by displaying volume on a horizontal scale rather than under each price candle.
- 😀 The Volume Profile identifies zones of interest, highlighting areas of high order concentration where price might struggle to advance or reverse.
- 😀 The tool uses three main lines: POC (Point of Control), VAL (Value Area Low), and VAH (Value Area High), which help in identifying key support and resistance levels.
- 😀 The POC line represents the price level with the highest traded volume and acts as a key point for monitoring price reversals.
- 😀 It’s important to note that the POC may not always be respected if there are no significant volume levels around it, leading to potential price movement beyond this region.
- 😀 The VAL and VAH help enhance the accuracy of volume profile readings and should be used together with POC for more reliable trading decisions.
- 😀 The Volume Profile tool can be used in both upward and downward trends to find potential reversal points or key areas where price may react.
- 😀 For practical use, the tool can be applied to any specific range of movement, much like using Fibonacci retracement levels, to identify high-volume price zones that may lead to pullbacks or breakthroughs.
Q & A
What is the Volume Profile tool in trading?
-The Volume Profile tool visualizes the amount of orders executed at different price levels during a specific time period. It helps traders identify areas of significant interest, such as support and resistance zones, by displaying volume distribution horizontally rather than vertically like traditional volume indicators.
Who created the Volume Profile tool, and when was it introduced?
-The Volume Profile tool was created by a Wall Street trader in the 1990s. It is relatively new compared to other trading theories, making it a modern yet highly effective tool for analyzing market volume.
What are the key components of the Volume Profile tool?
-The key components of the Volume Profile tool include POC (Point of Control), VAL (Value Area Low), and VAH (Value Area High). These components help traders identify price levels with the highest volume and predict potential support and resistance zones.
What does the POC (Point of Control) represent in the Volume Profile?
-The POC represents the price level with the highest volume traded during a given period. It is a key reference point for potential reversals. However, it's not always respected, especially if there's no significant volume around it.
How do VAL and VAH function in trading using the Volume Profile tool?
-VAL (Value Area Low) and VAH (Value Area High) mark the lower and upper boundaries of the 70% volume traded within a specific price range. VAL often acts as support, while VAH acts as resistance. These levels provide insight into where price may struggle to move past.
What is the main advantage of using Volume Profile over traditional volume indicators?
-Unlike traditional volume indicators that display volume per candle, the Volume Profile shows volume distribution horizontally across different price levels. This enables traders to pinpoint key price levels with high trading activity, providing more precise entry and exit points.
How can Volume Profile help identify support and resistance zones?
-Volume Profile identifies areas with significant volume concentration. These areas can act as support or resistance since they represent price levels where traders have placed many orders. High volume areas may lead to price reversals or consolidations.
How does Volume Profile help in trend analysis?
-In both uptrends and downtrends, Volume Profile highlights areas where price may face resistance or support due to heavy trading volume. This helps traders anticipate potential reversals or continuations, refining their entry points.
What is the relationship between Volume Profile and tools like Fibonacci or Fair Value Gap (FVG)?
-Volume Profile can be used alongside other tools like Fibonacci retracements or Fair Value Gap (FVG) to increase the accuracy of trade setups. These confluences allow traders to identify potential reversal zones more reliably when multiple indicators align.
What is a practical way to use Volume Profile in trading a downtrend?
-In a downtrend, you can apply Volume Profile to the range between the start and end of the move. The POC and other volume levels will help identify key points where the price is likely to react, such as a pullback or reversal at high-volume areas.
Outlines

This section is available to paid users only. Please upgrade to access this part.
Upgrade NowMindmap

This section is available to paid users only. Please upgrade to access this part.
Upgrade NowKeywords

This section is available to paid users only. Please upgrade to access this part.
Upgrade NowHighlights

This section is available to paid users only. Please upgrade to access this part.
Upgrade NowTranscripts

This section is available to paid users only. Please upgrade to access this part.
Upgrade NowBrowse More Related Video

Secret Volume Trading Strategy VRPR | How To Trade Volume Profile
The MOST POWERFUL Day Trading Indicator
The only 'VWAP' video you will ever need | VWAP Indicator | VWAP Bands Strategy | VWAP Trading

Volume Profile Trading Examples: Walkthrough

How to use FIXED RANGE VOLUME PROFILE (1 Minute Tutorial)

INTRADAY STRATEGY - PIVOT + VWAP + EMA
5.0 / 5 (0 votes)