Distribusi Normal • Part 11: Contoh Soal Menentukan Nilai Z dari Peluang / Luas Daerahnya (1)
Summary
TLDRThis video explains how to determine Z-scores in normal distribution problems, particularly when the area under the curve is known. The presenter walks through multiple examples, demonstrating how to use Z-tables to find corresponding Z-values based on given probabilities. The focus is on both positive and negative Z-scores, offering a detailed, step-by-step guide on how to reverse-engineer the calculation of Z-values from the area under the normal curve. The tutorial covers a variety of scenarios, making complex concepts easy to understand for viewers seeking to master normal distribution.
Takeaways
- 😀 The video covers how to determine the value of a standard normal variable (Z) given the probability or the area under the curve.
- 😀 The first example explains how to find the Z value corresponding to a probability of 0.3907 using a Z-table.
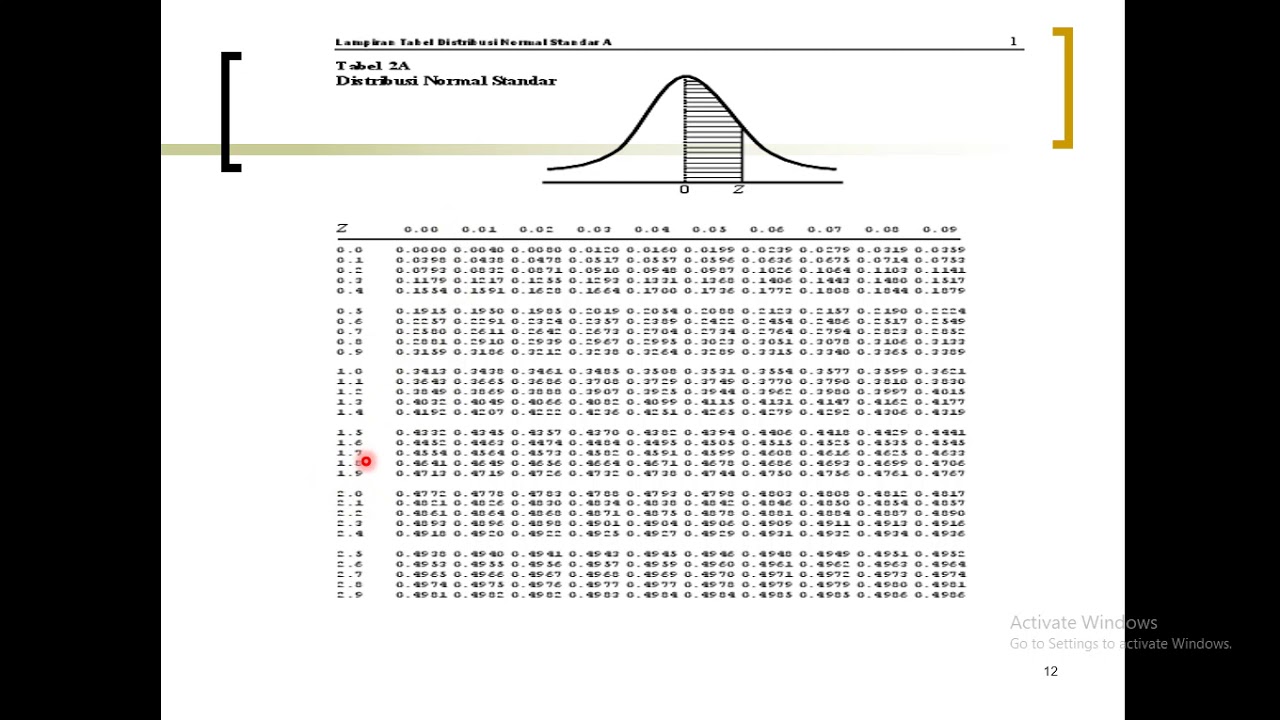
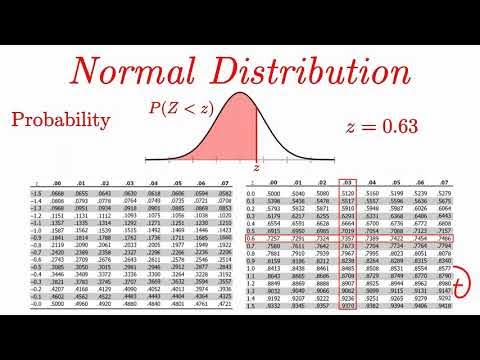
- 😀 The Z-table used shows the probability for the area under the standard normal curve from 0 to Z, and helps determine the Z value for a given probability.
- 😀 In the first example, after finding the closest probability value in the table (0.3907), the Z value is found to be 1.23.
- 😀 The second example discusses how to determine the Z value for a probability of 0.9406, where the total probability is between negative infinity and Z.
- 😀 For the second example, the curve is drawn to visually represent the probability, and the area is split into two parts to aid in calculation.
- 😀 Using the Z-table, the probability of 0.4406 is found, which corresponds to a Z value of 1.56 in the table.
- 😀 The third example introduces a probability of 0.6406, with a focus on negative Z values and their relationship to the probability.
- 😀 The symmetry of the normal distribution is used in the third example to transform a probability into a positive Z value, giving a final answer of -0.36 for Z.
- 😀 The examples demonstrate how to manipulate the area and probability relationships under the normal curve to find Z values, including handling negative values and using symmetry.
- 😀 The video ends with a reminder for viewers to check the complete playlist for more related lessons and encourages them to leave questions or comments.
Q & A
What is the main topic of this video?
-The main topic of the video is about understanding and solving normal distribution problems, particularly how to find the Z-score when the probability or area under the normal curve is given.
What is the significance of Z-scores in normal distribution?
-Z-scores are used to determine how many standard deviations a data point is from the mean in a normal distribution. They are essential for calculating probabilities and understanding the distribution of data.
How do you find the Z-score when the probability (or area under the curve) is given?
-To find the Z-score, you refer to the standard normal distribution table. You locate the probability (or area) under the curve and use the table to find the corresponding Z-score.
In the first example, what is the Z-score corresponding to a probability of 0.3907?
-The Z-score corresponding to a probability of 0.3907 is 1.23, found by referring to the standard normal distribution table.
What is the difference between using a standard normal distribution table for left and right tail probabilities?
-For left-tail probabilities, the area starts from 0 and goes to the Z-score. For right-tail probabilities, the area starts from negative infinity and goes to the Z-score. You may need to adjust your approach based on which tail of the curve the probability refers to.
How do you approach finding a Z-score when the probability is given for a right-tail (i.e., starting from negative infinity)?
-In this case, you draw the curve and recognize that the probability refers to the area from negative infinity to the Z-score. You then split the probability into two parts and use the normal distribution table to solve for the Z-score.
What is the Z-score corresponding to a probability of 0.9406 for a right-tail probability?
-The Z-score corresponding to a probability of 0.9406 is 1.56, found by splitting the probability and using the standard normal distribution table.
How do you handle negative Z-scores in normal distribution problems?
-When encountering negative Z-scores, you reflect the values to positive Z-scores using the symmetry of the normal distribution. This means that a negative Z-score corresponds to a positive value in the standard normal distribution table.
In the third example, how do you handle a probability of 0.6406?
-For a probability of 0.6406, the Z-score is negative because the area lies on the left side of the mean. You split the probability into two parts, calculate the corresponding Z-scores using the table, and then adjust for the negative Z-score.
Why is the standard normal distribution table important for solving these problems?
-The standard normal distribution table is crucial because it provides the cumulative probabilities (or areas under the curve) for various Z-scores. This allows us to find the Z-score corresponding to a given probability or vice versa.
Outlines

This section is available to paid users only. Please upgrade to access this part.
Upgrade NowMindmap

This section is available to paid users only. Please upgrade to access this part.
Upgrade NowKeywords

This section is available to paid users only. Please upgrade to access this part.
Upgrade NowHighlights

This section is available to paid users only. Please upgrade to access this part.
Upgrade NowTranscripts

This section is available to paid users only. Please upgrade to access this part.
Upgrade NowBrowse More Related Video
CONVERTING A NORMAL RANDOM VARIABLE TO A STANDARD NORMAL VARIABLE AND VICE VERSA
Distribusi Normal | Konsep Dasar dan Sifat Kurva Normal | Matematika Peminatan Kelas 12

Distribusi Normal Bagian 1 Matematika Minat Kelas XII Semester 2

Z-Scores, Standardization, and the Standard Normal Distribution (5.3)
Distribusi Probabilitas Normal
Normal Distribution EXPLAINED with Examples
5.0 / 5 (0 votes)