K Nearest Neighbors | Intuitive explained | Machine Learning Basics
Summary
TLDRThe K-Nearest Neighbors (KNN) algorithm is a simple supervised learning method used for both classification and regression problems. It classifies points based on their proximity to other points, using a distance function like Euclidean distance. The classification is determined by a majority vote of the k nearest neighbors, and for regression, it's the average of the neighbors' labels. The optimal value of k balances overfitting and underfitting, which can be fine-tuned through cross-validation. The video also includes a code example with the Iris dataset, demonstrating the effect of different k values on classification decision boundaries.
Takeaways
- 😀 K-Nearest Neighbor (KNN) is a simple supervised machine learning algorithm used for both classification and regression tasks.
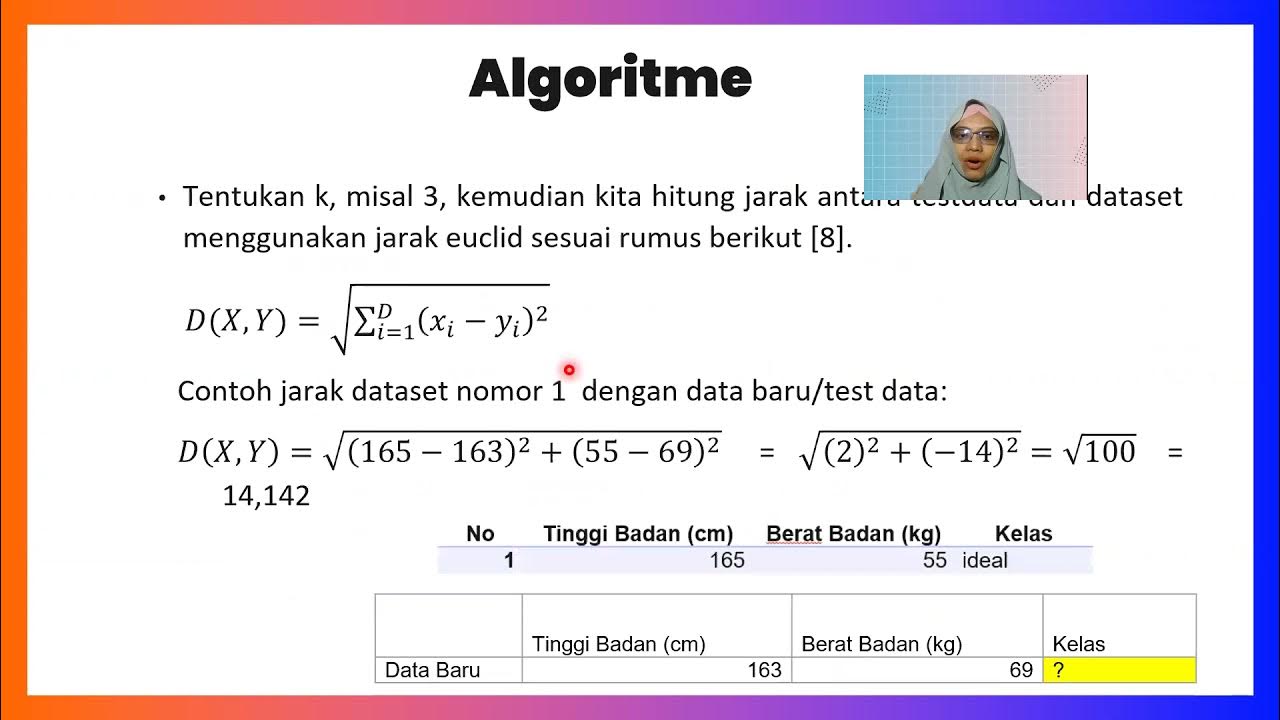
- 😀 To classify a point, the KNN algorithm calculates the distance between the given point and other data points, often using Euclidean distance.
- 😀 The nearest neighbors are sorted by distance, and for classification, the point is assigned to the class that is most common among its k nearest neighbors.
- 😀 The 'k' value in KNN controls the balance between overfitting and underfitting. A small 'k' leads to low bias but high variance, while a large 'k' leads to high bias but low variance.
- 😀 The optimal 'k' value can be found through cross-validation and analyzing learning curves.
- 😀 For regression problems, KNN predicts the value by taking the average of the k nearest neighbors' values.
- 😀 The script uses the Iris dataset, specifically the first two features, to demonstrate the KNN algorithm.
- 😀 Scikit-learn’s KNN implementation is simple and self-explanatory, making it easy for users to experiment with different parameters.
- 😀 Two plots visualize the decision boundary for classification with different 'k' values: the left one with k=15 and the right one with k=3.
- 😀 The video encourages viewers to experiment with KNN by adjusting parameters to understand how they impact the model’s performance.
- 😀 The video is part of the 'Bitesize ML Concept' series, and viewers are encouraged to engage by commenting, liking, and subscribing for more content.
Q & A
What is the K nearest neighbor (KNN) algorithm used for?
-The K nearest neighbor (KNN) algorithm is a simple supervised machine learning algorithm used for both classification and regression problems.
How does the KNN algorithm classify a point?
-In classification, the KNN algorithm classifies a point by taking a vote from its k nearest neighbors. The point is assigned to the class most common among its neighbors.
What is the purpose of calculating distances in KNN?
-The distances are calculated between the given point and other points in order to determine the k nearest neighbors. This is done to classify or predict the value of the given point based on the neighbors.
What is the most commonly used distance function in KNN?
-The most commonly used distance function in KNN is the Euclidean distance.
What role does the 'k' value play in the KNN algorithm?
-The 'k' value controls the balance between overfitting and underfitting. A small 'k' value can lead to low bias but high variance, while a large 'k' value can result in high bias but low variance.
How is the optimal 'k' value determined?
-The optimal 'k' value is typically determined using cross-validation and learning curves, where different 'k' values are tested to find the best one.
What happens when the KNN algorithm is used for regression?
-In regression, the KNN algorithm predicts the value of a point by taking the average of the values of its k nearest neighbors.
What dataset was used in the script to demonstrate the KNN algorithm?
-The script uses the famous Iris dataset, taking only the first two features for demonstration purposes.
What is shown in the plots presented in the script?
-The plots show the classification decision boundaries for different values of 'k'. The left plot has k = 15, and the right plot has k = 3.
What effect does the value of 'k' have on the classification decision boundary?
-A smaller 'k' value (like k = 3) tends to create a more complex decision boundary with higher variance, while a larger 'k' value (like k = 15) smooths the decision boundary and reduces variance, potentially increasing bias.
Outlines

This section is available to paid users only. Please upgrade to access this part.
Upgrade NowMindmap

This section is available to paid users only. Please upgrade to access this part.
Upgrade NowKeywords

This section is available to paid users only. Please upgrade to access this part.
Upgrade NowHighlights

This section is available to paid users only. Please upgrade to access this part.
Upgrade NowTranscripts

This section is available to paid users only. Please upgrade to access this part.
Upgrade NowBrowse More Related Video

Konsep Algoritma KNN (K-Nearest Neigbors) dan Tips Menentukan Nilai K

K-nearest Neighbors (KNN) in 3 min
K-Nearest Neighbors Classifier_Medhanita Dewi Renanti
Lecture 3.4 | KNN Algorithm In Machine Learning | K Nearest Neighbor | Classification | #mlt #knn

All Learning Algorithms Explained in 14 Minutes

Week 2 Lecture 6 - Statistical Decision Theory - Classification
5.0 / 5 (0 votes)