Break Even Point, titik impas
Summary
TLDRThis video explains key concepts in economics, focusing on Total Cost (TC), Total Revenue (TR), and Break-Even Point (BEP). It breaks down the formula for TC, which combines fixed and variable costs, and discusses how TR is determined by price and quantity. The video walks viewers through calculating the BEP in both units and monetary terms. Additionally, it guides how to graphically represent these concepts, illustrating how the TC and TR curves intersect at the BEP. The explanation is both detailed and accessible, with clear examples and visual aids.
Takeaways
- 😀 The Total Cost (TC) formula is 100,000 + 200q, where 100,000 is the fixed cost and 200 represents the average variable cost per unit.
- 😀 Total Revenue (TR) is calculated using the formula TR = p * q, where p is the price (400 in this case) and q is the quantity.
- 😀 To calculate the Break-Even Point (BEP) in units, use the formula: BEP (units) = Fixed Cost / (Price - Variable Cost per unit).
- 😀 For BEP in units, the fixed cost is 100,000, the price is 400, and the variable cost per unit is 200.
- 😀 The BEP in units is found to be 500, meaning that at 500 units, the company breaks even.
- 😀 To find the Break-Even Point (BEP) in revenue, substitute the BEP in units into the TR formula, giving a BEP of 200,000 in revenue.
- 😀 The graph of TC starts from the fixed cost (100,000) and increases due to variable costs as quantity increases.
- 😀 The graph of TR starts at the origin (0, 0), representing zero revenue at zero units sold, and increases with the price per unit.
- 😀 The intersection of the TC and TR graphs represents the Break-Even Point, where both revenue and cost are equal (500 units, 200,000 in revenue).
- 😀 In the graph, TR is represented by a line starting from 0,0, while TC begins at the fixed cost of 100,000 and slopes upward due to variable costs.
- 😀 Understanding how the cost and revenue lines behave helps to visually identify the BEP, where profit begins once TR surpasses TC.
Q & A
What is the meaning of TC in the context of this script?
-TC refers to the Total Cost function, which in this script is represented as TC = 100,000 + 200q. The term 'TC' refers to both fixed and variable costs in the production process.
What does the term 'fixed cost' (FC) mean here?
-In the script, fixed cost (FC) is represented by the value 100,000, which is a cost that does not change regardless of the quantity produced.
How is the Total Revenue (TR) calculated in this script?
-Total Revenue (TR) is calculated as TR = p * q, where 'p' is the price per unit, and 'q' is the quantity. In this case, the price 'p' is 400.
What is the purpose of determining the Break-even Point (BEP)?
-The Break-even Point (BEP) is used to determine the point at which total revenue equals total cost, meaning no profit or loss is made. This is crucial for assessing when a business becomes profitable.
How do you calculate BEP in units?
-To calculate BEP in units, the formula used is BEP (in units) = Fixed Costs / (Price - Variable Costs). In this script, the calculation is based on fixed cost (100,000), price (400), and variable cost (200).
What is the significance of the formula for BEP?
-The formula for BEP helps determine how many units need to be sold for the business to cover its fixed and variable costs. In this case, it results in 500 units being the break-even point.
How do you find the Break-even Point in monetary terms?
-To find the BEP in monetary terms, multiply the break-even quantity (500 units) by the price per unit (400). This gives the total revenue at the break-even point, which in this case is 200,000.
What does the graph represent in this script?
-The graph shows the relationship between Total Cost (TC) and Total Revenue (TR). The TC line starts from the fixed cost, while the TR line starts from the origin. The point where these two lines intersect represents the break-even point.
How do the Total Cost (TC) and Total Revenue (TR) lines behave on the graph?
-The Total Cost line starts from the fixed cost (100,000) and increases with the variable cost as the quantity increases. The Total Revenue line starts from 0,0 and increases linearly based on the price per unit and quantity.
What happens at the break-even point on the graph?
-At the break-even point on the graph, the Total Revenue (TR) and Total Cost (TC) lines intersect. This indicates that total revenue equals total cost, meaning the business is neither making a profit nor a loss at this quantity of 500 units.
Outlines

This section is available to paid users only. Please upgrade to access this part.
Upgrade NowMindmap

This section is available to paid users only. Please upgrade to access this part.
Upgrade NowKeywords

This section is available to paid users only. Please upgrade to access this part.
Upgrade NowHighlights

This section is available to paid users only. Please upgrade to access this part.
Upgrade NowTranscripts

This section is available to paid users only. Please upgrade to access this part.
Upgrade NowBrowse More Related Video
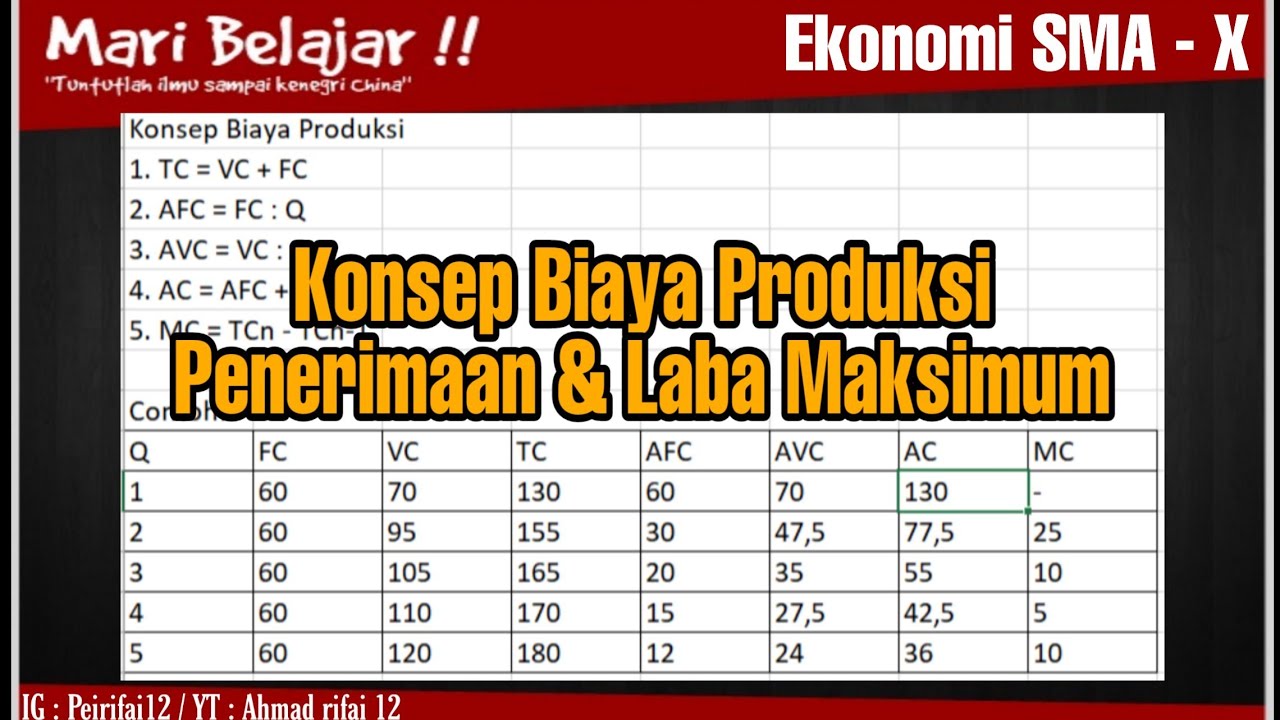
Cara Menghitung Biaya Produksi, Penerimaan dan Laba Maksimum

Break Even Point Kerajinan dari Limbah Berbentuk Bangun Datar | Kewirausahaan Kelas 11
Titik Impas (Break Even Point) Usaha Makanan Internasional- Prakarya dan Kewirausahaan Kelas 11

TUTORAL EXCEL GRAFIK BREAK EVEN POINT
TR, TC Approach & MR, MC Approach for Equilibrium Under Perfect Competition

BREAK EVEN POINT (BEP)
5.0 / 5 (0 votes)