Module08Video02
Summary
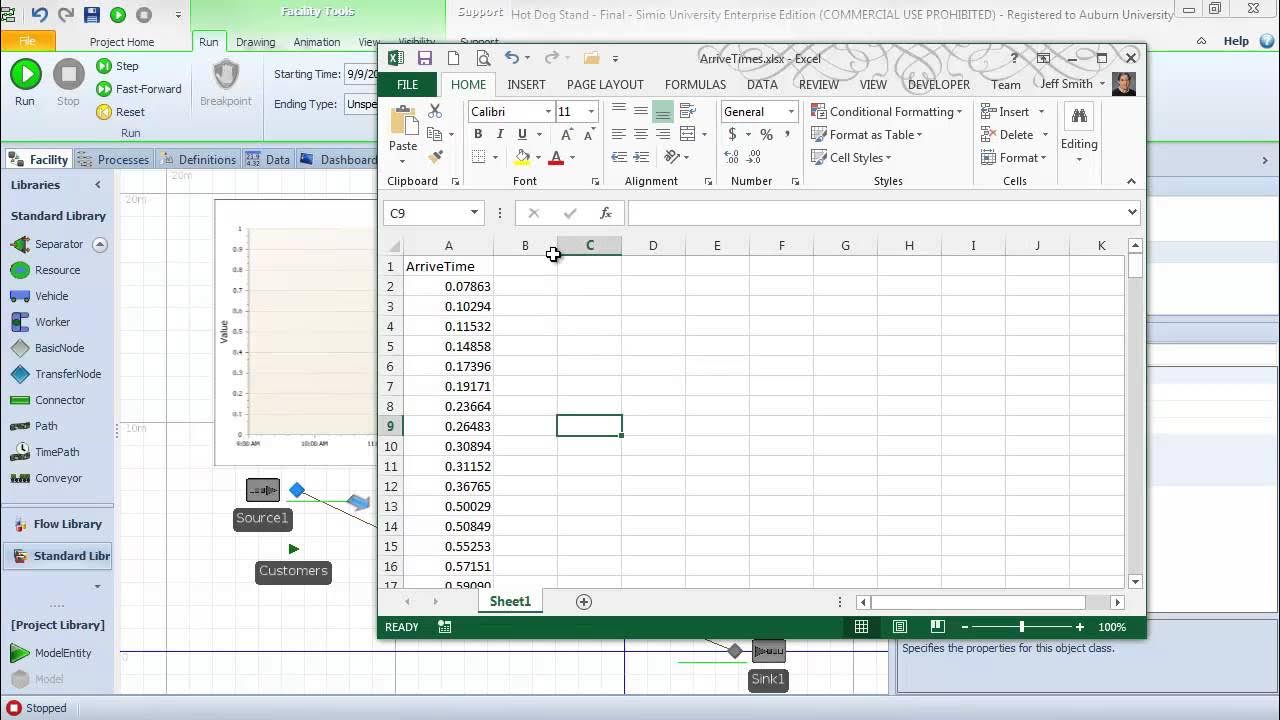
TLDRThis video explores the simulation of a hot dog stand using SIMO, focusing on the impact of time-varying customer arrival rates. The stand operates from 9:00 AM to 3:00 PM, with customer arrivals fluctuating throughout the day: 20 customers per hour in the morning, 60 during the lunch rush, and 25 in the afternoon. The video demonstrates how these varying rates affect queue size and service efficiency, introducing a rate table to model the arrival rate. It highlights the challenges of managing peak demand and provides insights into optimizing server capacity during high-traffic periods.
Takeaways
- 😀 The video discusses a SIMO model to simulate a hot dog stand's queuing system with time-varying customer arrival rates.
- 😀 The hot dog stand operates from 9 AM to 3 PM with historical data showing an average of 210 customers per day.
- 😀 Customer arrival rates vary throughout the day, with higher rates during lunch hours (60 customers per hour).
- 😀 The standard queuing model assumes Poisson arrivals (exponential inter-arrival times) and exponential service times.
- 😀 In the basic MM1 model, customer arrivals and service rates are assumed constant, resulting in a steady state utilization of 87.5%.
- 😀 The model simulates a terminating system where customer arrivals stop at 3 PM, but service continues until the last customer is served.
- 😀 To implement time-varying arrival rates, the SIMO rate table feature is used, dividing the day into 2-hour intervals.
- 😀 The model includes three key arrival rate periods: 20 customers per hour (9-11 AM), 60 customers per hour (11 AM-1 PM), and 25 customers per hour (1-3 PM).
- 😀 During peak lunch hours (11 AM-1 PM), the demand exceeds the service capacity, leading to a backlog.
- 😀 Experimentation with different server availability and time-varying arrivals helps analyze system performance during different periods of the day.
Q & A
What is the focus of the SIMO model in this simulation?
-The focus of the SIMO model in this simulation is to explore a queuing system for a hot dog stand, where the customer arrival rates vary with time throughout the day, with specific emphasis on modeling the lunch rush and the system’s response to time-varying demand.
How are customer arrival rates structured throughout the day?
-Customer arrival rates vary during the day: from 9:00 a.m. to 11:00 a.m. the rate is 20 customers per hour, from 11:00 a.m. to 1:00 p.m. the rate increases to 60 customers per hour (the lunch rush), and from 1:00 p.m. to 3:00 p.m. the rate drops to 25 customers per hour.
What assumptions are made about the service and arrival times in the initial M/M/1 queuing model?
-In the initial M/M/1 queuing model, it is assumed that the arrival times follow a Poisson process (exponentially distributed inter-arrival times), and the service times are exponentially distributed with a mean service time of 1.5 minutes per customer.
What is the calculated system utilization in the standard queuing model, and what does it indicate?
-The system utilization is calculated as 87.5% (35 customers per hour arriving versus a service rate of 40 customers per hour). This indicates that, under normal circumstances, the server can handle the incoming customer demand without being overloaded.
What changes are made to the model to account for the time-varying arrival rates?
-To account for time-varying arrival rates, a rate table is created in SIMO to specify different arrival rates for three 2-hour intervals during the day. The model is modified to use this rate table for controlling customer arrivals at different times.
What is the impact of the lunch rush on the queuing system?
-During the lunch rush (11:00 a.m. to 1:00 p.m.), the arrival rate of customers exceeds the service rate, causing the system to become overloaded. This results in a growing queue and longer wait times for customers, as the server can only handle 40 customers per hour but 60 customers are arriving per hour.
How does the simulation track the number of customers in the system over time?
-The simulation tracks the number of customers in the system using a status plot that shows the instantaneous number of customers in the system at any point in time, allowing the user to visually monitor how the queue evolves, especially during peak times like the lunch rush.
What is the significance of the maximum number in system (max NIS) metric?
-The maximum number in system (max NIS) metric is used to track the peak load of the system at any point in the simulation. It helps identify the worst-case scenario in terms of how many customers are in the system at the highest point during the simulation.
How do the results from the time-varying arrival rate model compare to the standard queuing model?
-The results from the time-varying arrival rate model show a higher maximum number in the system and longer average times in the system, particularly during the lunch rush. In contrast, the standard queuing model assumes constant arrival rates, which results in lower maximum numbers and more predictable queuing behavior.
What recommendations are made to improve the system's performance during peak hours?
-To improve the system's performance during peak hours, such as the lunch rush, the hot dog stand could consider increasing server availability (e.g., hiring more staff) or improving the efficiency of service to handle the increased demand, thus reducing customer wait times and queue length.
Outlines

This section is available to paid users only. Please upgrade to access this part.
Upgrade NowMindmap

This section is available to paid users only. Please upgrade to access this part.
Upgrade NowKeywords

This section is available to paid users only. Please upgrade to access this part.
Upgrade NowHighlights

This section is available to paid users only. Please upgrade to access this part.
Upgrade NowTranscripts

This section is available to paid users only. Please upgrade to access this part.
Upgrade NowBrowse More Related Video
Module08Video03

CB2201 Operations Management - Lecture 07 Queueing Model

I made EVERY HOT DOG in the World! | Guga Foods

Stoichiometry with Mass: Stoichiometry Tutorial Part 2

MrEvan's Food Reviews - Episode 3 (Hot Dog With Chili)

ECON 2111 Ch. 15 Investment, Time and Capital Markets Pt. 1 PRESENT DISCOUNTED VALUE
5.0 / 5 (0 votes)