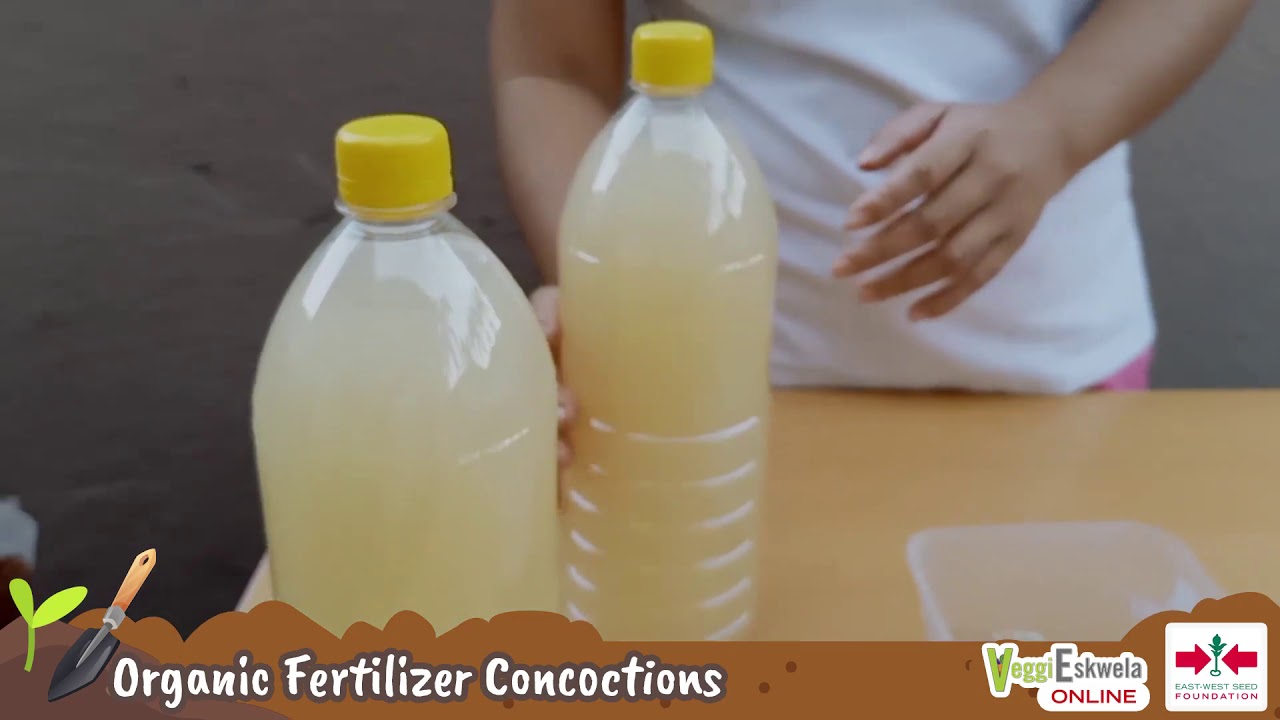
INFRA RED SPECTROSCOPY. How to analyze the diagram?
Summary
TLDRIn this educational video by Bu Eli, viewers learn about infrared spectroscopy and its application in analyzing fermented fruit beverages. The video explains how to interpret an infrared spectrum, highlighting key features such as the absence of a carbonyl group and the presence of distinct peaks indicating alcohol functional groups, specifically ethanol. Bu Eli provides step-by-step guidance on how to analyze the spectrum, focusing on absorption bands, such as those between 3,400 to 3,700 cm-1 for alcohol and around 1,050 cm-1 for alcohol's carbon-oxygen bond. The video concludes with tips for identifying functional groups in infrared spectra, aiding in the identification of chemical compounds in fermentation products.
Takeaways
- 😀 Infrared spectroscopy is used to analyze and describe the results of fermentation products, specifically fermented fruit drinks.
- 😀 The X-axis of an IR spectrogram represents wave numbers in cm^-1, which helps identify the spectroscopy technique, confirming it is infrared spectroscopy.
- 😀 If the spectrogram shows no peak around 1700 cm^-1, it indicates the absence of a carbonyl group, meaning the compound is not an aldehyde or carboxylic acid.
- 😀 A broad peak between 3400-3700 cm^-1 suggests the presence of an alcohol functional group (OH group). This is a key indicator in the analysis of fermented fruit drinks.
- 😀 Peaks around 1000 cm^-1 indicate C-O stretching in alcohols, reinforcing the identification of alcohols, especially primary alcohols.
- 😀 The IR spectrum analysis suggests that the fermented fruit drink contains ethanol, confirmed by multiple wave number clues.
- 😀 The CH stretching vibrations observed between 2850-2950 cm^-1 further support the presence of alcohol groups in the compound.
- 😀 The absence of carbonyl peaks and the presence of alcohol-related peaks (OH and C-O stretches) direct the analysis away from aldehydes and carboxylic acids.
- 😀 In ethanol, the functional group is confirmed through a characteristic peak at 3400-3700 cm^-1 (OH stretch) and around 1050 cm^-1 (C-O stretch).
- 😀 A clear understanding of IR spectroscopy principles allows for the accurate identification of alcohols in fermented products, using specific wave numbers for verification.
Q & A
What is the main topic of the video?
-The main topic of the video is infrared (IR) spectroscopy, specifically how to analyze and describe the IR spectrum of a fermented fruit beverage.
How can we identify that the spectrum is from an infrared (IR) spectroscopy analysis?
-We can identify that the spectrum is from an infrared analysis by looking at the X-axis, which shows wavenumbers in cm-1. The scale starts from around 500 and goes up to 4000, which is typical for IR spectroscopy.
What does the absence of a peak around 1700 cm-1 indicate in the IR spectrum?
-The absence of a peak around 1700 cm-1 indicates the absence of a carbonyl group (C=O), which is typically found in aldehydes and carboxylic acids. This helps rule out these compounds as possibilities.
What functional group is identified by a broad peak between 3400-3700 cm-1?
-A broad peak between 3400-3700 cm-1 corresponds to the O-H stretch, which is a characteristic feature of alcohols.
What does a peak around 1050 cm-1 indicate in the IR spectrum?
-A peak around 1050 cm-1 indicates a C-O stretch, which is typical of alcohols, specifically primary alcohols.
What absorption range in the IR spectrum is used to confirm the presence of alcohol?
-The absorption range between 3400-3700 cm-1 confirms the presence of the alcohol functional group, particularly the O-H stretch.
How can we differentiate between aldehydes, carboxylic acids, and alcohols using the IR spectrum?
-Aldehydes and carboxylic acids show a peak around 1700 cm-1 due to the carbonyl group, while alcohols show a broad peak around 3400-3700 cm-1 for the O-H stretch. The absence of the 1700 cm-1 peak in the spectrum indicates the compound is an alcohol.
What does the sharpness of the peak around 1050 cm-1 suggest about the alcohol?
-The sharpness of the peak around 1050 cm-1 suggests that the alcohol is a primary alcohol, as this peak corresponds to the C-O stretch in primary alcohols.
What is the role of the CH stretching peaks in the IR spectrum of alcohol?
-The CH stretching peaks around 2850-2950 cm-1 provide additional evidence for the presence of alcohols, as they correspond to C-H stretches found in alcohols.
Based on the IR spectrum analysis, what is the identified compound in the fermented fruit beverage?
-The identified compound in the fermented fruit beverage is ethanol, as indicated by the characteristic IR peaks for alcohol functional groups, including the O-H stretch and the C-O stretch.
Outlines

This section is available to paid users only. Please upgrade to access this part.
Upgrade NowMindmap

This section is available to paid users only. Please upgrade to access this part.
Upgrade NowKeywords

This section is available to paid users only. Please upgrade to access this part.
Upgrade NowHighlights

This section is available to paid users only. Please upgrade to access this part.
Upgrade NowTranscripts

This section is available to paid users only. Please upgrade to access this part.
Upgrade NowBrowse More Related Video


5.0 / 5 (0 votes)