PYRAMIDS OF : ENERGY, BIOMASS & NUMBERS
Summary
TLDRIn this lesson by Mr. Knight, ecological pyramids are discussed, focusing on comparisons between trophic levels in ecosystems. The variables examined include energy, biomass, and numbers. The lesson explains how energy decreases along the food chain, using an example with cabbage, caterpillars, and birds. It also covers pyramids of biomass, noting that biomass typically decreases up the food chain, except in aquatic ecosystems where it can be inverted. Lastly, the pyramid of numbers is illustrated, emphasizing how the number of organisms typically decreases as you move up trophic levels. The lesson concludes with a reminder of the importance of understanding these ecological concepts.
Takeaways
- 🌿 Ecological Pyramids are tools used to compare quantifiable biological variables such as energy, biomass, and numbers between trophic levels in an ecosystem.
- 🔍 The script provides an example of a simple food chain involving three trophic levels: a producer (cabbage), a primary consumer (caterpillars), and a secondary consumer (birds).
- ⏳ Energy decreases along the food chain due to organisms using some of it for their own functions, such as growth, development, and reproduction.
- 📉 The Pyramid of Energy illustrates the loss of energy at each trophic level, typically around 90%, leaving only about 10% to be passed on to the next level.
- 🌱 Biomass, which is the organic material that can be used as energy or fuel, also decreases along the food chain, with producers generally having more biomass than consumers.
- 🐟 An exception to the typical biomass pyramid is seen in aquatic ecosystems where biomass can increase along the food chain due to the small size of primary producers like phytoplankton.
- 📊 The Pyramid of Numbers represents the quantity of organisms at each trophic level, often starting with a larger base of producers and decreasing as one moves up the chain.
- 📈 The shape of the Pyramid of Numbers can vary depending on the numbers provided for each trophic level, but it typically has an upward shape with a larger base.
- 📚 The script emphasizes the importance of remembering and using the specific numbers provided in an example or an examination context to draw the pyramids accurately.
- 🌐 The lesson concludes with a reminder of the importance of the viewer's strength and a note of appreciation for watching the educational content.
- 👋 The instructor, Mr. Knight, signs off with a message of safety and a promise to continue the lessons in the future.
Q & A
What are ecological pyramids used for?
-Ecological pyramids are used to compare quantifiable biological variables between trophic levels in an ecosystem.
What are the three variables that ecological pyramids focus on?
-The three variables that ecological pyramids focus on are energy, biomass, and numbers.
What is an example of a food chain provided in the script?
-The example of a food chain provided in the script involves three trophic levels: a producer (cabbage), a primary consumer (eight caterpillars), and a secondary consumer (two birds).
Why does energy decrease along the food chain?
-Energy decreases along the food chain because each organism uses some of the energy for its own functions such as growth, development, reproduction, and other living functions.
How much energy is typically passed on from one trophic level to the next?
-In a typical situation, only about 10 percent of the energy is passed on from one trophic level to the next.
What is the relationship between biomass and the food chain?
-The pyramid of biomass is similar to that of energy because biomass consists of organic materials that can be used as energy or fuel. Typically, the biomass of producers is greater than that of consumers.
Why is the pyramid of biomass in an aquatic ecosystem inverted?
-The pyramid of biomass in an aquatic ecosystem is inverted because the producers are microscopic, and the organisms get larger as you go up the food chain, leading to an increase in biomass along the food chain.
What determines the shape of the pyramid of numbers?
-The shape of the pyramid of numbers is determined by the number of organisms at each trophic level. The relative size of the box in the pyramid is drawn according to these numbers.
What is a typical shape for a pyramid of numbers in an ecosystem?
-A typical pyramid of numbers has an upward shape starting from a larger base and decreasing as you go up, reflecting that there are usually more producers than consumers.
What does the script suggest is the strength of an individual?
-The script suggests that an individual's strength is as great as they will make it, implying that personal strength is a result of one's own efforts and determination.
What is the closing remark from the script to the viewers?
-The closing remark from the script is a reminder for viewers to stay safe until the next lesson.
Outlines

This section is available to paid users only. Please upgrade to access this part.
Upgrade NowMindmap

This section is available to paid users only. Please upgrade to access this part.
Upgrade NowKeywords

This section is available to paid users only. Please upgrade to access this part.
Upgrade NowHighlights

This section is available to paid users only. Please upgrade to access this part.
Upgrade NowTranscripts

This section is available to paid users only. Please upgrade to access this part.
Upgrade NowBrowse More Related Video

Symmetrical Name Monsters with Mr. Snyder
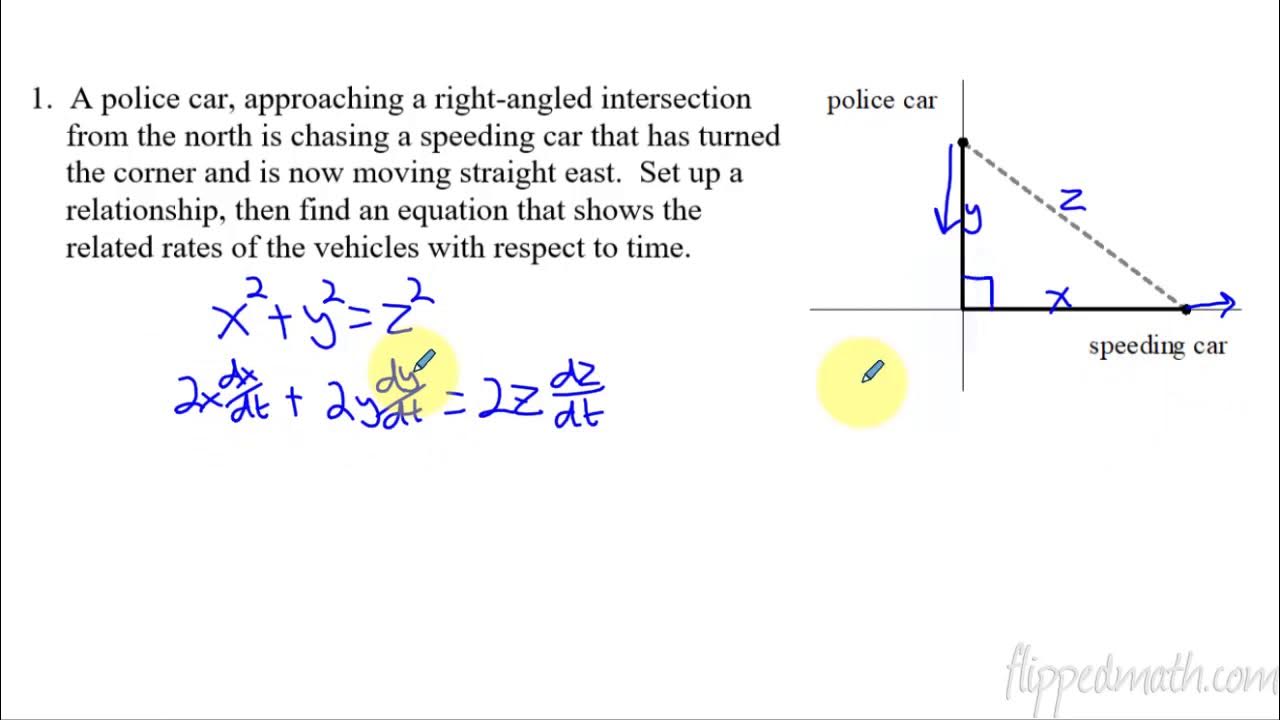
Calculus AB/BC – 4.4 Introduction to Related Rates

Countryballs Learn Music

The Bear and Bees丨Audio Picture Book丨Fairy Tales丨Bedtime Stories for Kids in English

English Expressions: three-word phrasal verbs

Penggunaan Simple Present Tense dan Contohnya | Kampung Inggris LC
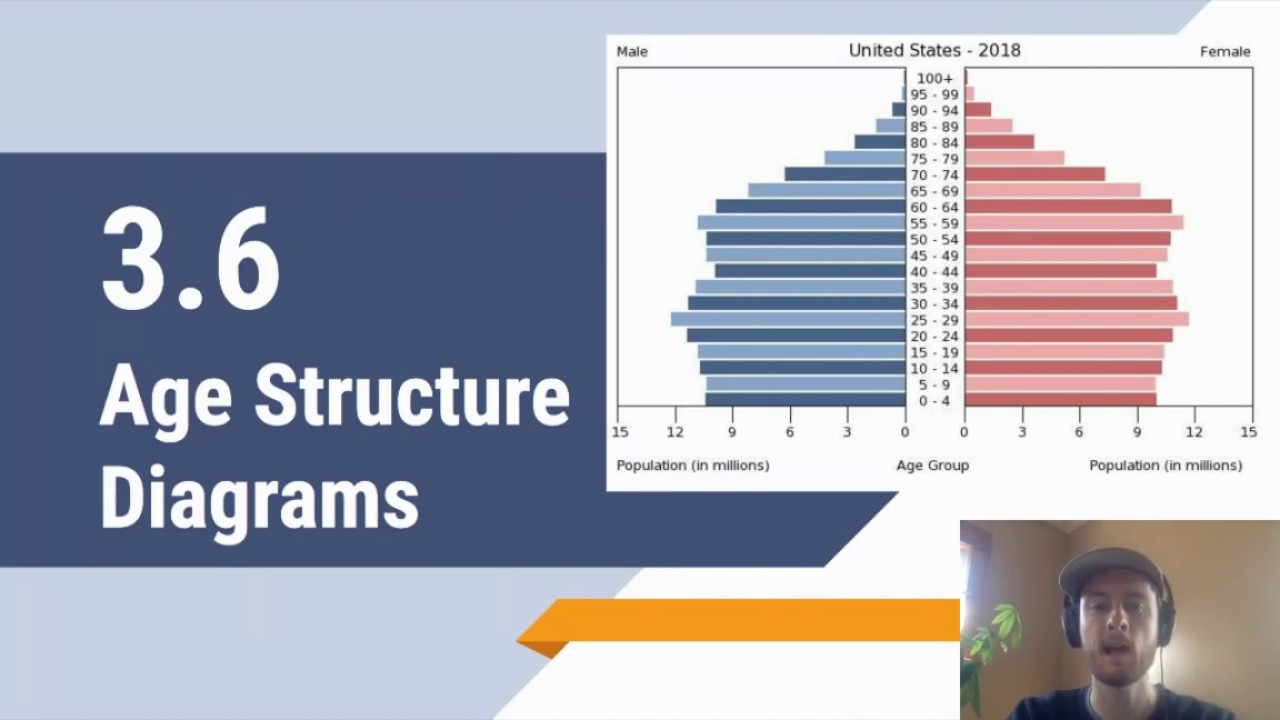
APES Video Notes 3.6 - Age Structure Diagrams
5.0 / 5 (0 votes)