Create a Rigorous Physical Process Model as an Easy Start to a Data Flow Diagram
Summary
TLDRThis video guides viewers through the process of creating a rigorous physical process model (RPPM), a valuable tool for business analysis. By using simple symbols—circles to represent people or departments, and arrows for data or material flows—the model provides a clear, visual representation of how data moves within an organization. Through an example scenario, the video demonstrates how to analyze a process, identify key players, and create a simple diagram that serves as the foundation for more detailed analysis like data flow diagrams. The RPPM is an easy-to-learn technique ideal for business analysts.
Takeaways
- 😀 A rigorous physical process model represents the movement of physical objects and data between organizational units.
- 😀 This model uses two simple symbols: circles to represent people or places, and arrows for the movement of data or material.
- 😀 The purpose of the model is to represent the real-world flow of data and physical objects within an organization as closely as possible.
- 😀 A rigorous physical process model is an easy entry point into the world of data flow diagramming and business process analysis.
- 😀 The model focuses on representing data flows between departments, rather than the internal processes within each department.
- 😀 When creating the model, business analysts should focus on identifying people and places, color-coding the nouns that represent these entities.
- 😀 The process begins by analyzing a narrative, identifying entities involved, and creating a diagram with circles for people/places and arrows for flows.
- 😀 The diagram should be created from left to right and top to bottom, following the reading conventions of many languages, for clarity.
- 😀 Once the model is created, it should be presented to the project sponsor for validation and used for further analysis or refinement into a context-level data flow diagram.
- 😀 The simplicity of the model aids in comprehension and retention, making it an effective tool for communication in business analysis.
- 😀 This technique is useful for anyone involved in business analysis, whether or not they hold the formal title of business analyst.
Q & A
What is the purpose of creating a rigorous physical process model?
-The purpose is to visualize and represent the flow of physical objects and data within an organization. It helps to map out how materials and data move between different units, ensuring an accurate and simple representation of the real-world process.
Why is the rigorous physical process model considered a good starting point for a data flow diagram?
-It is considered a good starting point because it simplifies the representation with just two symbols: a circle for people or places, and an arrow for the movement of materials or data. This simplicity makes it easy to create and a good precursor to more complex diagrams like data flow diagrams.
What symbols are used in a rigorous physical process model, and what do they represent?
-In a rigorous physical process model, a circle represents people or places (organizational units), and an arrow represents the flow of physical material or data between those units.
How does Tom Hathaway suggest organizing the elements when creating a rigorous physical process model?
-Tom Hathaway suggests organizing the elements from the upper left to the lower right of the page, following the left-to-right, top-to-bottom reading convention common in many languages like English. This makes the diagram easier to follow for most people.
What is the role of color coding in the process of creating the model?
-Color coding is used to highlight nouns that represent people or places. This helps to quickly identify the relevant organizational units that will be represented in the diagram.
What are some of the key entities that are identified during the creation of the rigorous physical process model?
-Key entities identified include customer, order entry department, credit department, warehouse, accounting, customer service, and customer (repeated as 'customer/2'). These entities represent the flow of data and materials in the process.
How are flows between the organizational units represented in the model?
-Flows between the organizational units are represented by arrows. Each arrow is labeled to indicate the type of data or material being transferred, such as 'new customer order,' 'shipment,' 'invoice,' and 'complaints.'
Why does the diagram include a second 'customer' symbol labeled 'customer/2'?
-The second 'customer' symbol, labeled 'customer/2,' is used to maintain the flow of the diagram while ensuring readability. It represents the customer receiving the shipment from the warehouse, preserving the left-to-right, top-to-bottom flow of the diagram.
What role does the diagram play once it's completed?
-Once completed, the diagram serves as a simple, clear representation of the process. It can be used to present the process to stakeholders, facilitating discussions by focusing on the flows and interactions between units.
How does the rigorous physical process model transition into a data flow diagram?
-After the rigorous physical process model is reviewed and approved, it can be transformed into a legitimate context-level data flow diagram, which includes more detailed elements of the system, such as processes and data stores.
Outlines

This section is available to paid users only. Please upgrade to access this part.
Upgrade NowMindmap

This section is available to paid users only. Please upgrade to access this part.
Upgrade NowKeywords

This section is available to paid users only. Please upgrade to access this part.
Upgrade NowHighlights

This section is available to paid users only. Please upgrade to access this part.
Upgrade NowTranscripts

This section is available to paid users only. Please upgrade to access this part.
Upgrade NowBrowse More Related Video

Create a Context-Level DFD to Visualize Project Scope
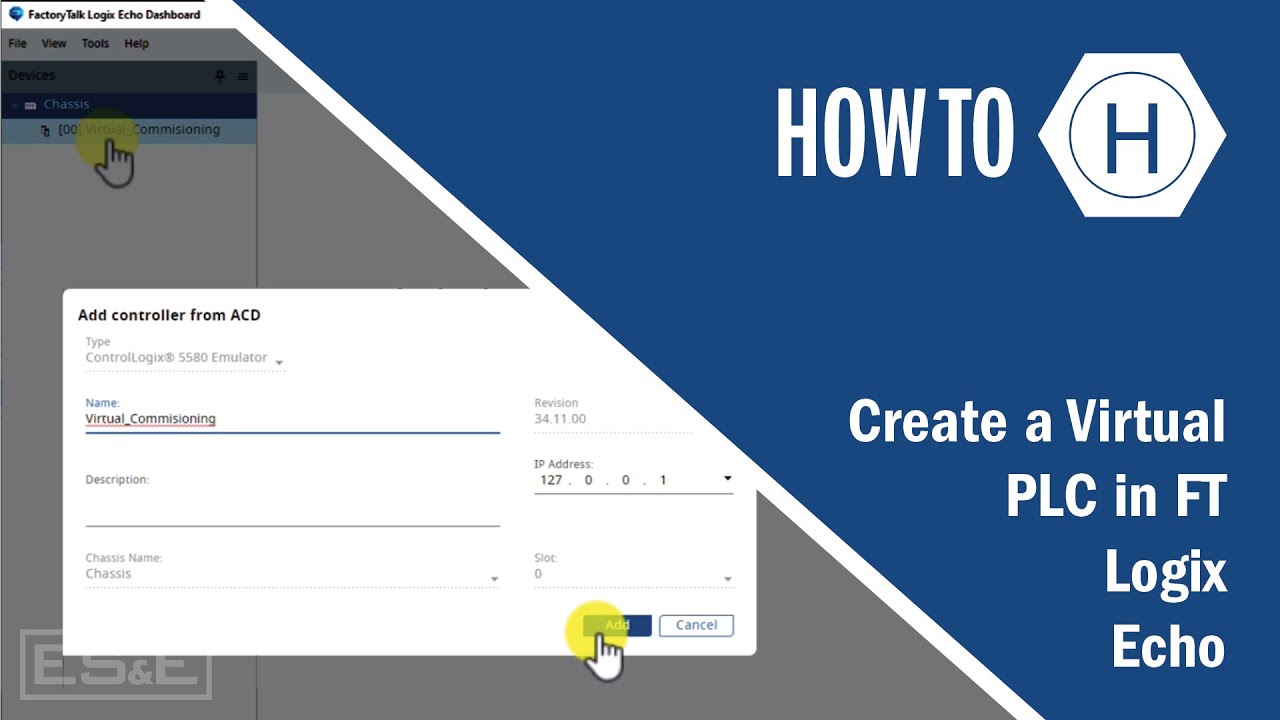
Create a Virtual PLC in FT Logix Echo
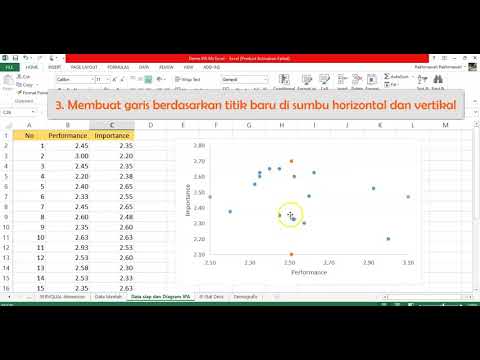
7 Diagram IPA Ms Excel (2) | Importance Performance Analysis Ms Excel
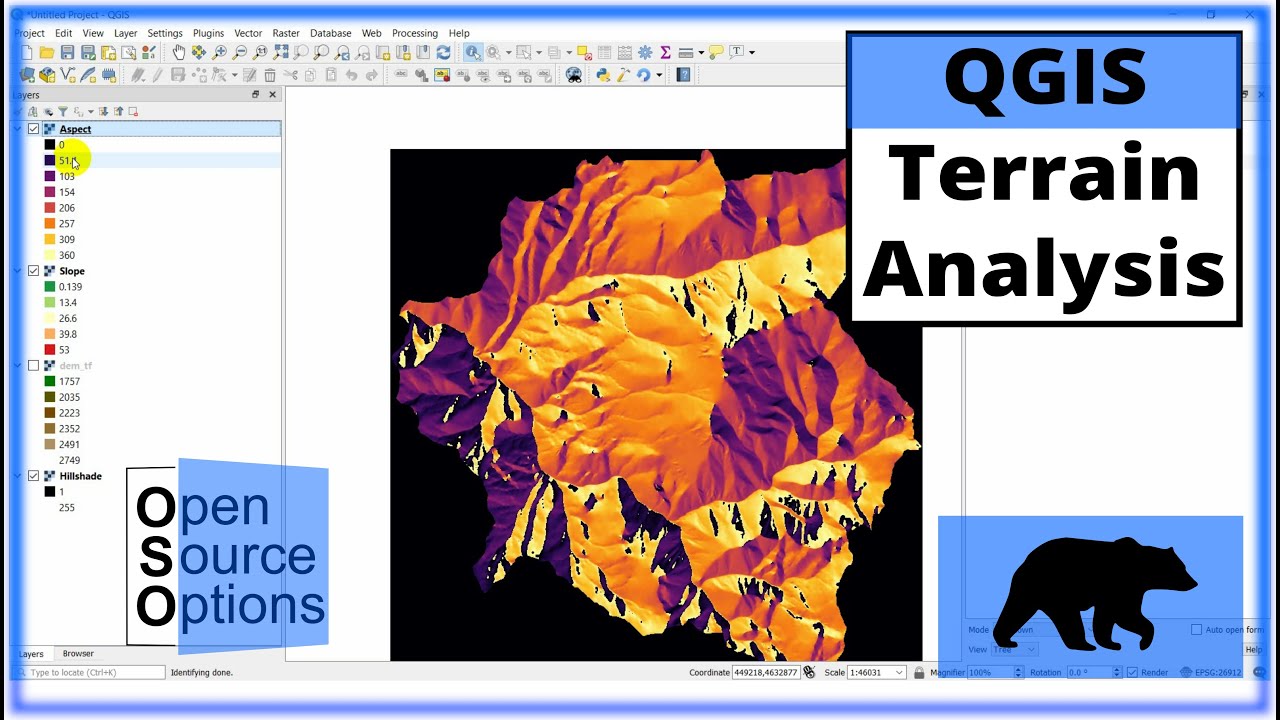
QGIS Terrain Analysis: hillshade, slope, aspect (Version 3.x)
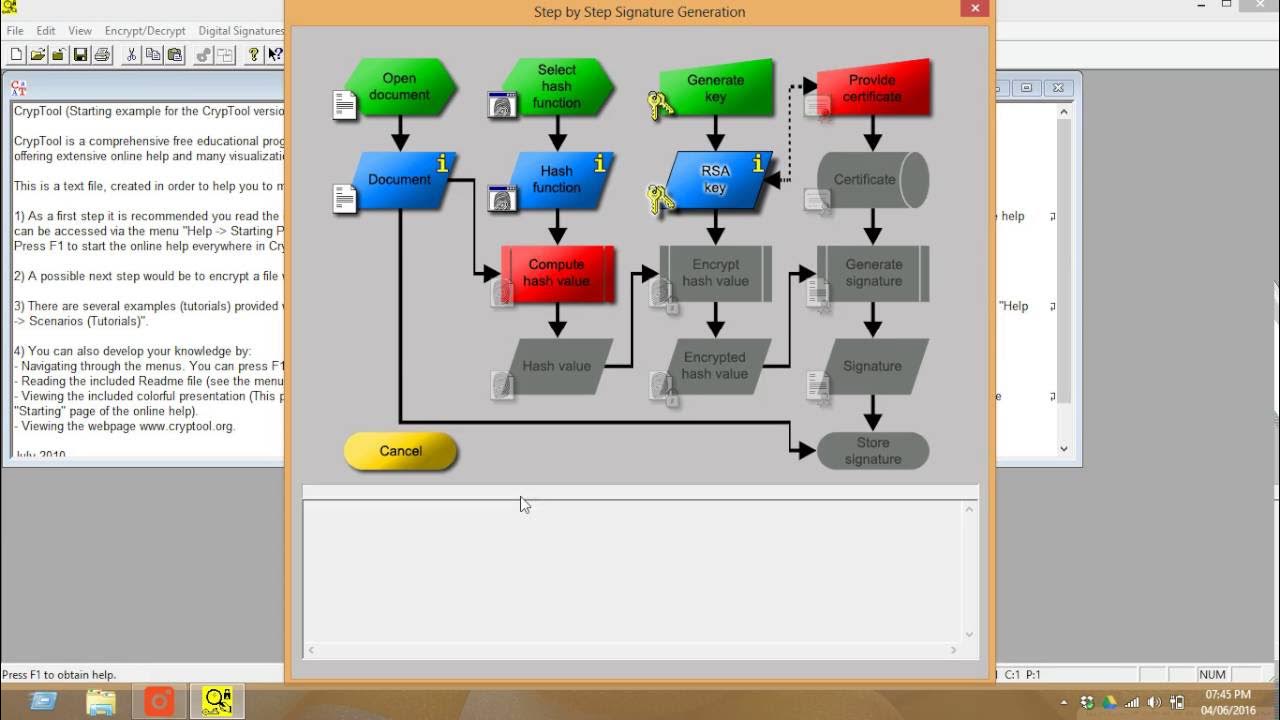
How to use CrypTool for creating the digital signature for documents
Tutorial Mastercam X5 CNC Mill / Fraish
5.0 / 5 (0 votes)