Introduction - Week wise of the course
Summary
TLDRThe script outlines a comprehensive educational program aimed at teaching students to analyze and interpret data sets effectively. It covers the basics of data and numerical methods, focusing on understanding the importance of questions in data set research. The course progresses to discuss concepts of uncertainty and probability, introducing counting principles and permutation as fundamental tools. It also aims to develop students' ability to make informed decisions and predictions based on data, using graphical summaries and statistical measures. The program concludes with an exploration of Bayesian methods, emphasizing the application of these concepts in real-world scenarios.
Takeaways
- 📚 The course is designed to be a proposal-based exercise program aimed at new students and taught by new students, focusing on those who have completed their tenth standard education in mathematics.
- 🔢 It covers both the structure and numerical techniques, emphasizing the application of statistics as a tool for expanding discussions on uncertainty and mathematical theory.
- 🎯 The ultimate goal of the course is to provide students with a solid foundation for critical thinking, enabling them to understand and analyze numerical data sets effectively.
- 📈 The course will explore the creation of relevant questions based on data sets, training students to focus on the right metrics and numerical summaries to answer those questions.
- 📊 In the initial modules, students will be introduced to various types of data sets and will learn to categorize them, with a focus on developing questions that can be answered using appropriate numerical techniques.
- 📉 The course will delve into categorical methods, aiming to help students identify the right tools and techniques needed to answer questions based on the data provided.
- 📝 Students will learn to summarize numerical data, exploring central tendencies and variability, and will be introduced to graphical summaries to visualize data effectively.
- 🤝 The course will address the relationships between data points, teaching students how to categorize and summarize data using contingency tables and understand the importance of the research question.
- 📚 By the end of the course, students are expected to have a good understanding of data, basic concepts, and how to think critically about the data presented to them.
- 📊 The course will also touch on the basics of counting principles and permutations, helping students understand the fundamentals of probability and how to apply them.
- 🎲 The final modules will focus on developing students' ability to make inferences and predictions, using the concepts of chance and probability to answer complex questions.
Q & A
What is the purpose of the course discussed in the script?
-The course is a proposal-based training program intended for students who have completed their high school education in mathematics. It aims to provide a comfortable learning experience for such individuals.
What are the main topics covered in the course?
-The course covers topics such as the structure and numerical techniques, the use of imagination in the face of uncertainty, and the application of mathematical theory as a tool.
What is the expected outcome after completing the course?
-The course aims to provide students with a solid foundation of understanding data, basic concepts, and the ability to think critically about data sets and the questions being researched.
How does the course approach the concept of uncertainty?
-The course extensively discusses the concept of uncertainty and its management, emphasizing the use of mathematical theory as a tool to deal with it.
What is the significance of the data sets discussed in the script?
-Data sets are used to teach students how to create relevant questions and focus on numerical summaries, which is essential for understanding and analyzing data.
How does the course plan to deal with the complexity of data?
-The course will categorize various types of data sets and focus on teaching students how to construct appropriate questions and numerical summaries.
What is the role of 'categorical methods' in the second part of the course?
-Categorical methods are used to focus on the type of questions that need to be answered using appropriate numerical techniques.
How will the course address the issue of variability in data?
-In the third module, the course will use numerical summaries to explain how to summarize numerical data, focusing on central tendencies and variability.
What is the importance of understanding the relationship between variables in the course?
-Understanding the relationship between variables is crucial as it helps in categorizing and summarizing data in a way that can be analyzed effectively.
How does the course plan to introduce the concept of probability?
-In the fifth and sixth modules, the course plans to introduce the basic elements of counting and permutation, explaining how these fundamental concepts are applied.
What is the relevance of the discussion on events and their probabilities in the course?
-The discussion on events and their probabilities is relevant as it helps students understand the uncertainty involved in various scenarios and how to make educated guesses or predictions.
How will the course help students in making decisions based on data?
-The course will guide students in understanding the value of different summaries and how to make decisions based on the data, especially when dealing with multiple-choice questions.
What is the final module of the course focused on?
-The final modules, 11 and 12, are focused on understanding and developing the concept of hypothesis, which is crucial for making inferences from data.
Outlines

This section is available to paid users only. Please upgrade to access this part.
Upgrade NowMindmap

This section is available to paid users only. Please upgrade to access this part.
Upgrade NowKeywords

This section is available to paid users only. Please upgrade to access this part.
Upgrade NowHighlights

This section is available to paid users only. Please upgrade to access this part.
Upgrade NowTranscripts

This section is available to paid users only. Please upgrade to access this part.
Upgrade NowBrowse More Related Video

Video Pembelajaran Matematika Kelas 7 SMP ( Pengolahan Data )

Investigasi Statistika Hal 185-193 Bab 6 DATA DAN DIAGRAM kelas 7 SMP Kurikulum Merdeka
Data & Diagram [Part 3] - Mencatat Data pada Tabel Frekuensi
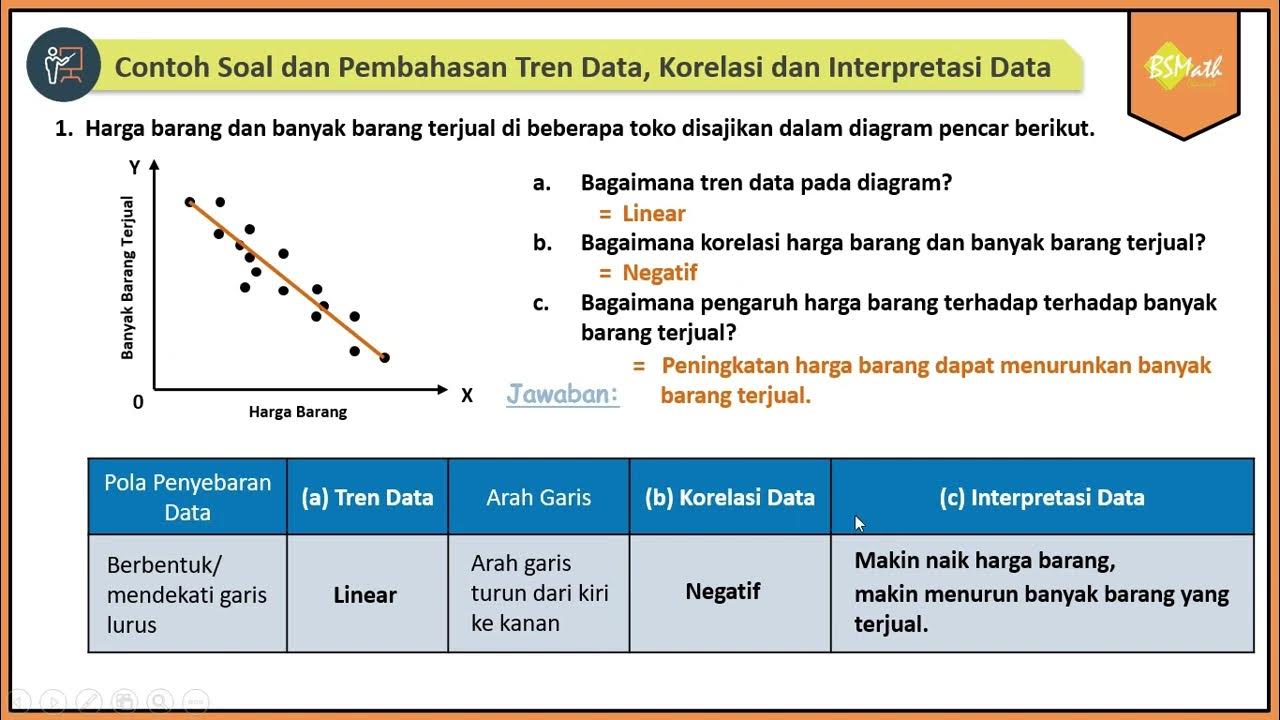
Contoh Soal dan Pembahasan Tren Data, Korelasi dan Interpretasi Data Bivariat Diagram Pencar
Penyajian Data (Part-1) ~ Tabel dan Diagram (Materi PJJ Kelas VII / 7 SMP)

Introduction to General Science and Ability | CSS | Noman Hafeez ( CSS 2019, Information Group)
5.0 / 5 (0 votes)