W & M Patter | Most Profitable Intraday Chart Patterns
Summary
TLDRIn this video, the speaker explains key chart patterns used in trading, specifically the Double Top and Double Bottom formations. These patterns indicate potential market reversals and are crucial for identifying entry points. The speaker discusses how to trade these patterns effectively, including conditions for breakout, risk management strategies like stop-loss placement, and profit-taking ratios. Additionally, the video covers advanced concepts like nested patterns and how to recognize rare setups for higher probabilities in trading. Visual examples from live charts are used to reinforce the concepts, making it easy to understand and apply in real-time trading scenarios.
Please replace the link and try again.
Q & A
What is the significance of the Double Bottom and Double Top patterns in trading?
-The Double Bottom and Double Top patterns are key chart patterns used in technical analysis. The Double Bottom pattern indicates a reversal from a downtrend to an uptrend, whereas the Double Top signals a potential reversal from an uptrend to a downtrend. These patterns are highly reliable in scalping, as they often present clear entry points with high probability of success.
What does a Double Bottom pattern represent in market behavior?
-A Double Bottom occurs when the market drops twice to a similar level, forms a support zone at the bottom, and then moves upward between the two bottoms. The pattern signifies a strong support region and often precedes a trend reversal from bearish to bullish.
How can a trader trade using the Double Bottom pattern?
-To trade the Double Bottom pattern, a trader should wait for the market to show a breakout after the second bottom. They should enter the trade after the breakout with a stop loss near the second bottom, and set a profit target with a risk-to-reward ratio of 1:4 to 1:5.
What is the key difference between Double Bottom and Double Top patterns?
-The Double Bottom pattern marks a potential trend reversal from a downtrend to an uptrend, while the Double Top pattern indicates a reversal from an uptrend to a downtrend. Both patterns involve two peaks or valleys, but in opposite market directions.
How do you trade using a Double Top pattern?
-In the Double Top pattern, a trader waits for the market to fail at the second peak, followed by a breakout downward. Once the market shows a closing candle below the neckline, they enter a short position with a stop loss placed near the second peak, aiming for a profit based on a reasonable risk-to-reward ratio.
What does 'W within a W' mean in the context of Double Bottom trading?
-A 'W within a W' occurs when a smaller Double Bottom pattern forms within a larger one. This can enhance the probability of success for the trade, as the smaller W indicates further confirmation of the trend reversal.
What is a 'No Neck W' pattern?
-A 'No Neck W' pattern occurs when a Double Bottom shows no clear neckline but instead creates a rejection candle at the second bottom, signaling a strong buy opportunity. The absence of a neckline makes it a less common, but still valid, trade setup.
How can a trader identify a good entry point in a 'No Neck W' pattern?
-In a 'No Neck W' pattern, a trader should look for a rejection candle at the second bottom and enter the trade when the candle closes. They should place a stop loss just below the second bottom and set a reasonable profit target based on the market movement.
Why is it important to consider trend alignment when trading Double Top and Double Bottom patterns?
-Aligning trades with the prevailing market trend increases the probability of success. Trading against the trend, such as entering a Double Top during an uptrend or a Double Bottom during a downtrend, can lead to higher risk and lower success rates.
What role does the concept of 'closing candles' play in executing trades based on Double Top and Double Bottom patterns?
-Closing candles are crucial for executing trades based on Double Top and Double Bottom patterns. A trader should enter a position once the breakout candle closes, as this confirms the pattern and reduces the risk of false signals from intraday fluctuations.
Outlines

This section is available to paid users only. Please upgrade to access this part.
Upgrade NowMindmap

This section is available to paid users only. Please upgrade to access this part.
Upgrade NowKeywords

This section is available to paid users only. Please upgrade to access this part.
Upgrade NowHighlights

This section is available to paid users only. Please upgrade to access this part.
Upgrade NowTranscripts

This section is available to paid users only. Please upgrade to access this part.
Upgrade NowBrowse More Related Video
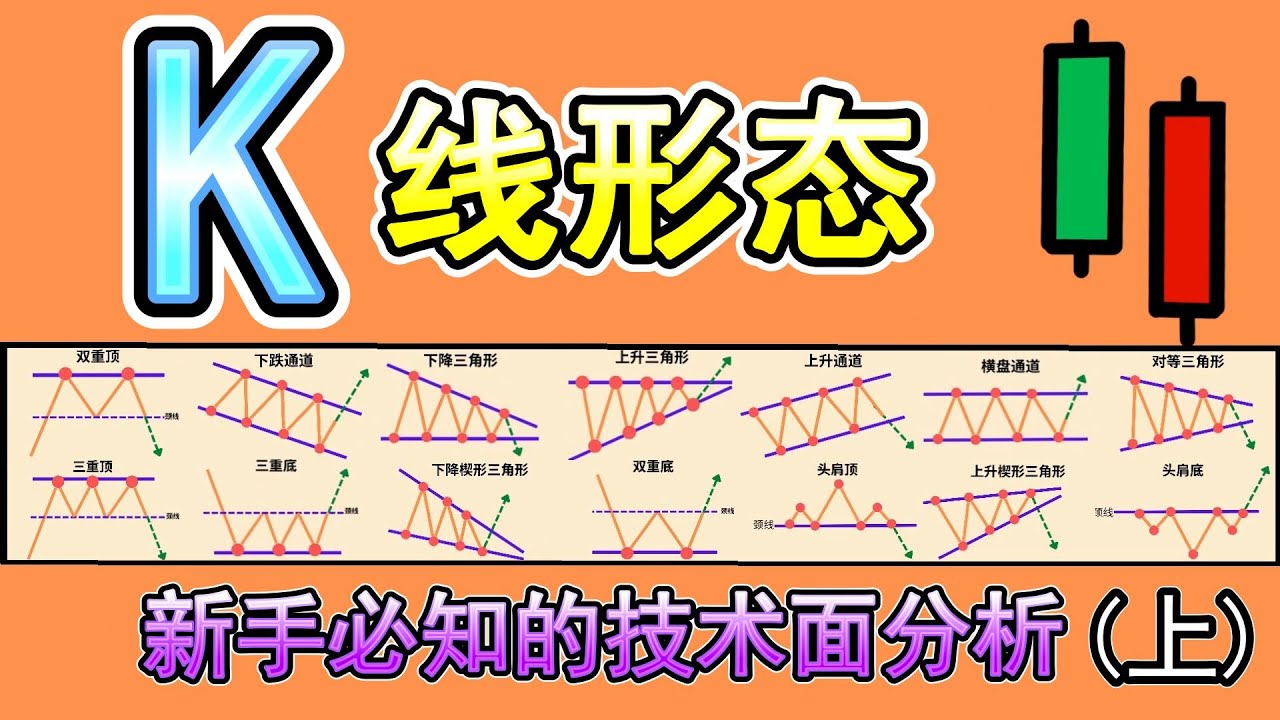
【K线形态 技术面分析】(上)你必知的18种K线形态完整教学|K线形态交易策略大公开|技术分析新手入门教学|专业交易员必备的K线形态技术分析|Chart Pattern Analysis

Best Bank Nifty Scalping Strategy || Golden 10% Q&A

Technical Analysis Tutorial for Beginners (13 Best Crypto TA Tips)

3 Signs That Tell You Exactly When The Trend Is OVER...(Reversal Trading Strategy)

Emini Review November 14th 2024 (Al Brooks Methods)(Bear Surprise, and then Bear Channel)

This Gold Scalping Strategy Still Makes $100s in Seconds!
5.0 / 5 (0 votes)