Cuartiles y Rango Intercuartílico para datos agrupados en intervalos
Q & A
What is the main purpose of the video?
-The video explains how to calculate quartiles and the interquartile range (IQR) for a set of grouped data, using a frequency table based on the ages of 60 people.
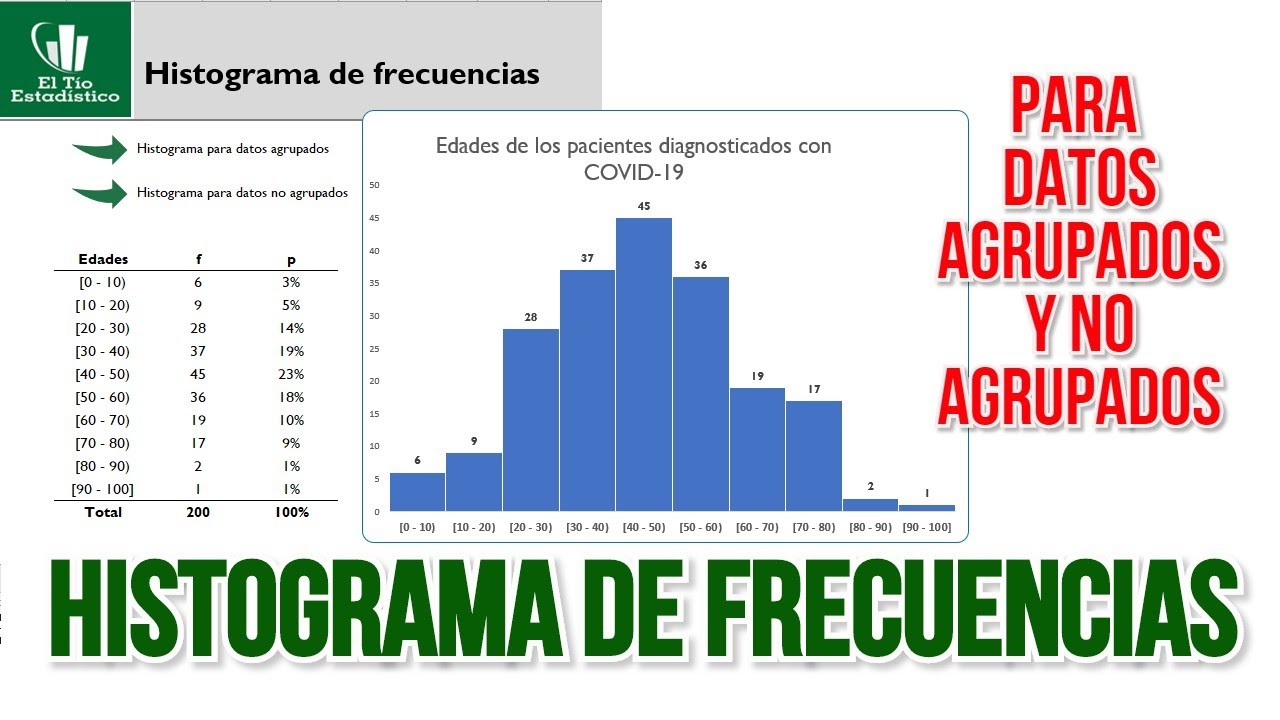
What does the frequency table represent in this example?
-The frequency table represents the ages of 60 people grouped into intervals, showing how many people fall within each age range.
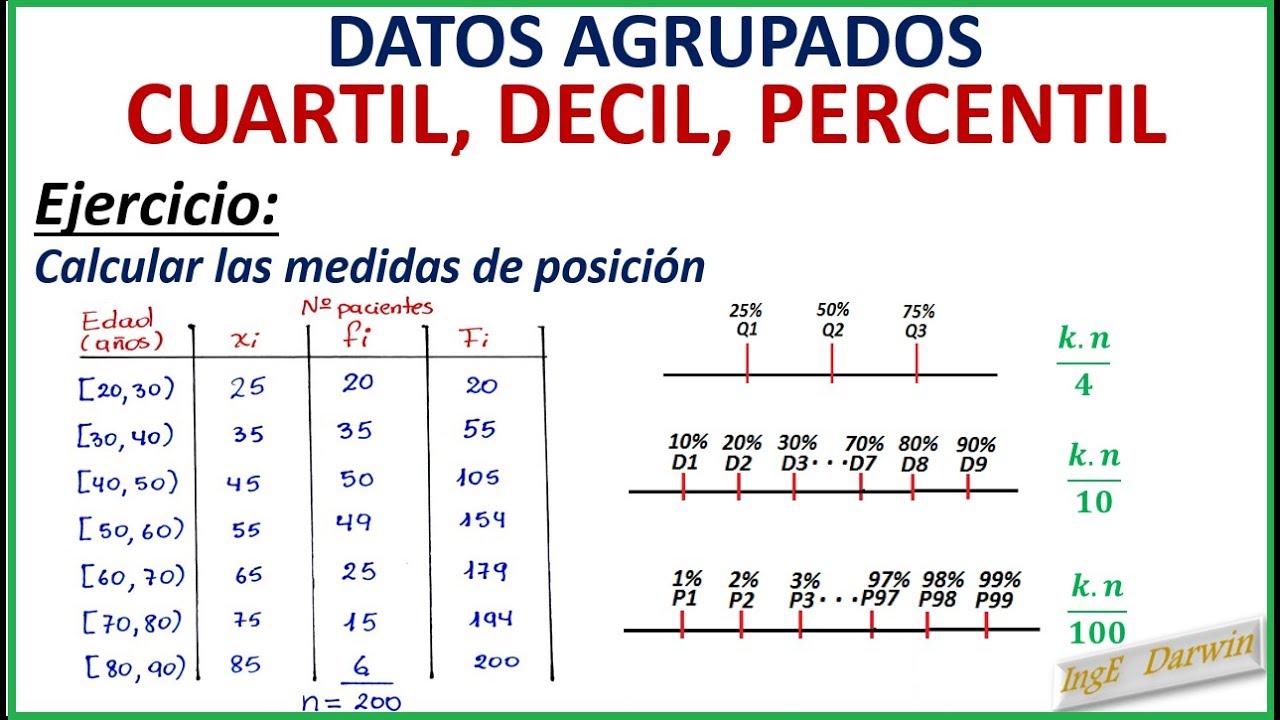
How do you calculate the position of the first quartile (Q1)?
-The position of Q1 is calculated by multiplying the total number of data points (60) by 1/4. This gives a position of 15, which corresponds to where Q1 falls in the cumulative frequency table.
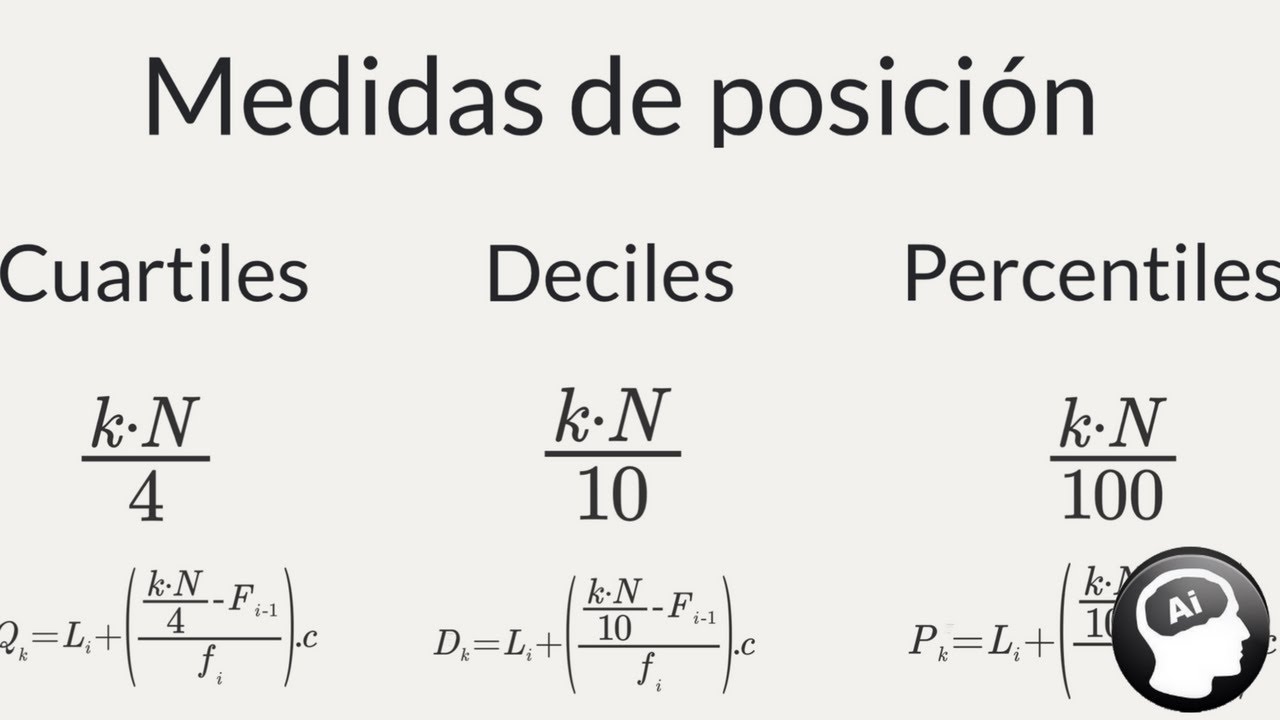
What is the formula used to calculate the quartiles?
-The formula for calculating any quartile is: Q = L + ((k * N / 4) - F) / f * h, where L is the lower boundary, N is the total number of data points, F is the cumulative frequency before the class of interest, f is the frequency of the class, and h is the class width.
Why is the frequency table's cumulative frequency important?
-The cumulative frequency helps locate the exact position of the quartiles in the data. It shows the running total of frequencies, allowing you to identify where each quartile falls.
What should you do if the exact position of a quartile is not found in the cumulative frequency table?
-If the exact position isn't found, you estimate where the quartile falls by identifying the interval that includes the position and using the surrounding data (previous and next frequencies) to calculate the quartile.
How do you calculate the interquartile range (IQR)?
-The interquartile range is calculated by subtracting Q1 from Q3. IQR = Q3 - Q1.
Why is the interquartile range an important measure?
-The interquartile range is important because it measures the spread of the middle 50% of the data, giving a more accurate picture of the data's variability than the range, which can be affected by extreme values.
What does it mean if the quartile value falls exactly on a boundary in the cumulative frequency table?
-If a quartile value falls exactly on a boundary, the quartile is equal to the upper boundary of the class interval where the position falls.
How are the quartiles related to the median in this context?
-The second quartile (Q2) is the same as the median, representing the middle value of the data set.
Outlines

This section is available to paid users only. Please upgrade to access this part.
Upgrade NowMindmap

This section is available to paid users only. Please upgrade to access this part.
Upgrade NowKeywords

This section is available to paid users only. Please upgrade to access this part.
Upgrade NowHighlights

This section is available to paid users only. Please upgrade to access this part.
Upgrade NowTranscripts

This section is available to paid users only. Please upgrade to access this part.
Upgrade NowBrowse More Related Video
Cómo hacer un histograma de frecuencias en Excel ✅ | Estadística Descriptiva ⭐

MEDIDAS DE DISPERSION PARA DATOS AGRUPADOS
Cuartiles, deciles y percentiles, datos agrupados, no agrupados, medidas de posición
MEDIDAS DE POSICIÓN (CUARTIL, DECIL, PERCENTIL) - DATOS AGRUPADOS

Tabla de Frecuencias - Datos Agrupados

CUARTILES, DECILES Y PERCENTILES PARA DATOS NO AGRUPADOS
5.0 / 5 (0 votes)