Step-by-Step Guide to IELTS Academic Writing Task 1 (BAR Chart)

Fastrack IELTS
27 Aug 202416:30

Summary

TLDRThis video script offers a detailed guide for IELTS students to excel in Writing Task 1, focusing on bar chart analysis. It emphasizes the importance of summarizing key trends, logically organizing data, and making comparisons. The presenter outlines a structure for a high-scoring response, highlighting the need for a clear overview, logical progression in body paragraphs, and the avoidance of mere number reporting. The script introduces the 'describe and support' formula to enhance task achievement and suggests using a variety of vocabulary and cohesive devices for a more impressive score.

Takeaways

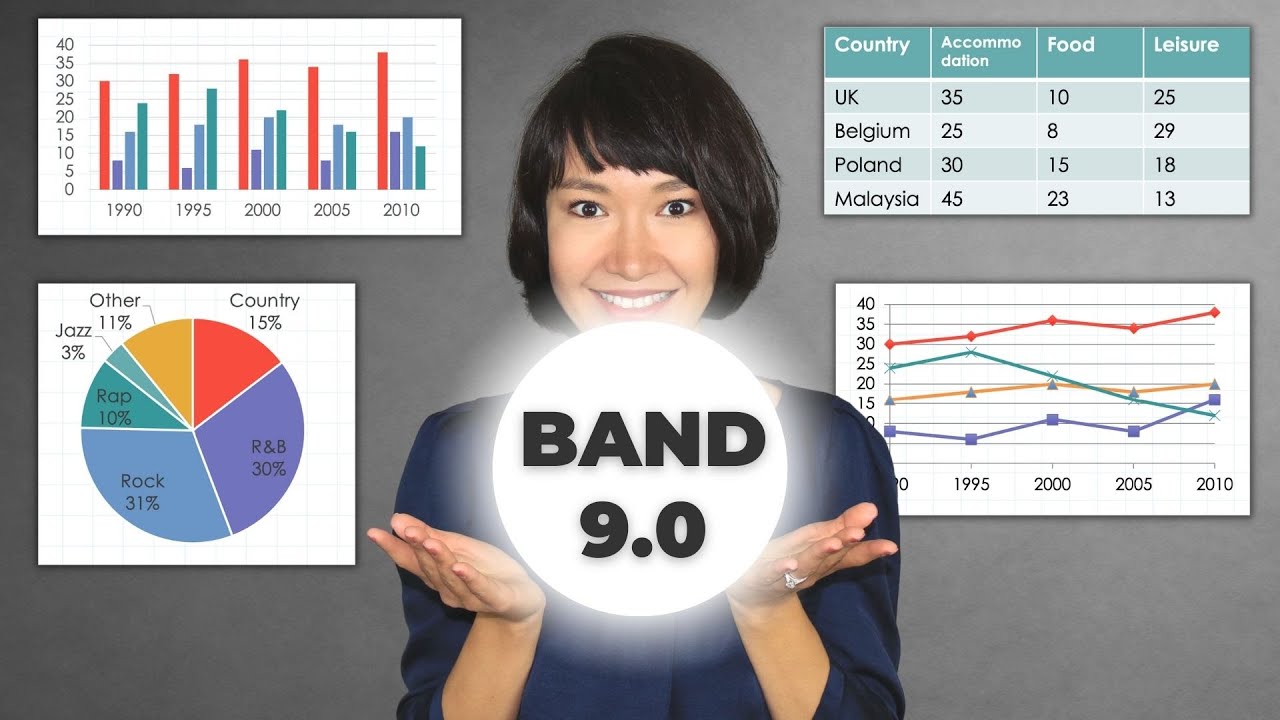
  • 📊 **Task Analysis**: The script discusses how to write a high-scoring IELTS Writing Task 1 response for a bar chart, emphasizing the importance of data analysis.
  • 🌐 **Global Trend**: A clear trend of increasing urbanization is observed across most regions, with the exception of Oceania where it slightly decreased.
  • 📈 **Data Organization**: The script advises organizing data logically in body paragraphs, grouping similar regions together for clarity.
  • 📝 **Overview Requirement**: It's crucial to present a clear overview in the opening paragraph to meet the task achievement criterion.
  • 🔍 **Detail vs. Overview**: While details are important, the script stresses the need to balance them with an overall trend to achieve a high band score.
  • 📋 **Paragraph Structure**: The script outlines a structure consisting of an introduction and three body paragraphs, omitting a conclusion for Task 1.
  • 📉 **Comparative Language**: Using comparative language and complex structures is key to meeting grammar requirements and impressing examiners.
  • 🗣️ **Descriptive Approach**: The 'describe and support' method is introduced as a strategy for writing paragraphs and sentences that enhance task achievement.
  • 📚 **Vocabulary Flexibility**: The script highlights the need for varied vocabulary, including less common words and precise synonyms, to demonstrate lexical resourcefulness.
  • 🔗 **Cohesive Devices**: Using a range of cohesive devices such as linking words, pronouns, and synonyms helps in creating a cohesive and logical response.
  • ✍️ **Mistake Avoidance**: Accuracy in reporting numbers is crucial; any errors can negatively impact the task achievement score.

Q & A

  • What is the most common type of task students received in recent IELTS Academic Writing Task 1?

    -The most common type of task is a bar chart.

  • What does the IELTS Writing Task 1 instruction typically ask students to do?

    -The instruction asks students to summarize the information by selecting the main features and make comparisons where necessary.

  • Why does the task demand more data analysis than most students realize?

    -The task demands more data analysis because it requires identifying main trends or differences and organizing information logically, which often gets overlooked.

  • What is the big trend that the instructor noticed in the chart?

    -The big trend is that in most regions, the urbanization rates are going up, with Oceania being the exception where it went down slightly.

  • How should the information be organized in the body paragraphs of the IELTS Writing Task 1?

    -The information should be organized logically, with body paragraphs dedicated to different groups of regions based on their urbanization rates and trends.

  • What is the structure of an IELTS Writing Task 1 response according to the script?

    -The structure should include an opening paragraph for introduction and overview, followed by several body paragraphs describing the data, with no need for a conclusion.

  • What is the 'describe and support' formula mentioned in the script?

    -The 'describe and support' formula involves starting a paragraph or sentence with a general idea about the data, followed by details or numbers to support that idea.

  • Why is it important to use a variety of complex structures in the IELTS Writing Task 1?

    -Using a variety of complex structures, such as comparatives, different verb tenses, passive voice, and complex clauses, helps to meet the examiner's requirements for a high band score.

  • How can using 'less common words' improve the vocabulary score in IELTS Writing Task 1?

    -Using less common words, which are not necessarily rare but more specific and precise, can show flexibility and depth of vocabulary, thus improving the score.

  • What is the golden rule for writing Task 1 answers according to the script?

    -The golden rule is to describe what the data means and support it with numbers, which makes the writing more logical, cohesive, and varied in vocabulary and grammar.

  • Why is it crucial to get the numbers right when writing about data in IELTS Writing Task 1?

    -Getting the numbers right is crucial because any mistakes can reduce the task achievement score as examiners will notice them.

Outlines

00:00

📊 Understanding IELTS Writing Task 1: Bar Chart Analysis

This paragraph introduces the task of analyzing a bar chart in an IELTS Writing Task 1 exam. The speaker discusses the common challenge students face with this type of task and emphasizes the importance of data analysis. The paragraph outlines the task requirements, such as summarizing information, identifying main trends, and making necessary comparisons. The speaker also introduces the concept of 'real requirements' used by examiners to assess responses, hinting at the need for a clear overview and logical organization of information.

05:02

🌐 Global Urbanization Trends in IELTS Writing

The paragraph delves into the specifics of describing global urbanization trends using the data from the bar chart. It focuses on how to write an overview that captures the main trend of increasing urbanization, with the exception of Oceania. The speaker advises on structuring the body paragraphs logically, grouping data from different regions based on their similarity. The paragraph also covers the importance of comparative language and complex grammatical structures to meet the assessment criteria for a high band score.

10:05

📈 Describing and Supporting Data in IELTS Task 1

This section teaches the strategy of 'describe and support' for writing IELTS Task 1 answers. The speaker illustrates how to logically sequence paragraphs and sentences, starting with a general idea followed by detailed data. The paragraph discusses the urbanization rates of North America, Europe, and Latin America, showing how to provide key features and support them with specific numbers. It also touches on the importance of using a varied vocabulary and grammar, and the correct use of percentages and approximations to enhance task achievement.

15:11

🔗 Cohesive Devices and Conclusion in IELTS Task 1 Writing

The final paragraph focuses on the use of cohesive devices to link ideas and information within the IELTS Task 1 response. It discusses the need to contrast and compare data using words like 'however' and phrases like 'in contrast'. The speaker also provides a concise example of how to write about the unique case of Oceania, which shows minimal variation in urbanization rates. The paragraph concludes with a reminder of the importance of using a variety of formal linkers and a suggestion to watch an in-depth lesson for further understanding.

Mindmap

Keywords

💡Academic Writing Task 1

Academic Writing Task 1 refers to the first part of the IELTS writing section, which requires test takers to describe, summarize, and explain information from a visual representation such as a graph, chart, or diagram. In the video, the instructor focuses on how to approach this task to achieve a high score, emphasizing the importance of data analysis and logical organization of information.

💡Band 8.5 Answer

A Band 8.5 Answer refers to a high-scoring response in the IELTS writing section, indicating advanced proficiency in English. The video aims to guide students on how to craft such responses for Writing Task 1 by meeting the assessment criteria set by the examiners.

💡Bar Chart

A Bar Chart is a type of graph that represents data with rectangular bars with lengths proportional to the values they represent. The script mentions that students often encounter bar charts in their exams, and the video provides a step-by-step guide on how to analyze and describe such charts effectively.

💡Summarize

To summarize in the context of IELTS Writing Task 1 means to provide a concise overview of the main features of the data presented in the visual aid. The video script emphasizes the need to summarize the information by selecting the main features and making comparisons where necessary.

💡Data Analysis

Data Analysis involves examining, cleaning, transforming, and modeling data to extract useful information, draw conclusions, and support decision-making. The video script points out that many students overlook the need for thorough data analysis in their Writing Task 1 answers, which can affect their scores.

💡World Averages

World Averages refer to the mean values of a dataset across the globe. In the script, world averages are mentioned as a reference point for comparing the urbanization rates of different regions.

💡Urbanization

Urbanization is the process where an increasing number of people live in urban areas. The video script uses urbanization rates to discuss the trends in population shifts from rural to urban areas across different regions and time periods.

💡Main Trends

Main Trends refer to the significant patterns or directions observed in the data. The video script instructs students to identify these trends to present a clear overview in their Writing Task 1 answers.

💡Logical Organization

Logical Organization means arranging information or ideas in a way that is easy to follow and understand. The video emphasizes the importance of logically organizing the data in body paragraphs for a coherent Writing Task 1 response.

💡Comparatives

Comparatives are used to compare the qualities or quantities of two or more items. The script mentions the use of comparatives as a way to fulfill the requirement of making comparisons where relevant in the IELTS Writing Task 1.

💡Complex Structures

Complex Structures refer to advanced grammatical constructions that include clauses, phrases, and other elements that add complexity and nuance to language. The video script advises students to use a variety of complex structures to meet the examiners' expectations for high-scoring responses.

💡Cohesive Devices

Cohesive Devices are words or phrases that connect sentences and paragraphs, making the text flow smoothly. The video script discusses the use of cohesive devices such as linking words, pronouns, and synonyms to improve the overall coherence of the writing.

💡Approximations

Approximations are rough estimates of numerical values. The script advises using approximations when describing data in Writing Task 1 to avoid being overly precise with numbers, which can make the writing more natural and less mechanical.

Highlights

Students often encounter bar charts in IELTS Academic Writing Task 1.

To achieve a high score, students must summarize the main features and make comparisons where necessary.

The task demands more data analysis than most students realize.

Examiners use band descriptors to assess the clarity of overview and appropriate categorization of data.

The main trend in the data is an increase in urbanization rates, except for Oceania.

Information and ideas should be logically organized with a clear progression.

The data should be organized logically in body paragraphs.

The opening paragraph should introduce and give an overview of the content.

The task does not require a conclusion, so students should save time.

Global urbanization rates increased from under 40% to 56% and are expected to exceed 66% by 2050.

Asia and Africa had the lowest urban populations in 1975 but are expected to increase by 15% by 2050.

Comparing regions is crucial for a high task achievement score.

A variety of complex grammatical structures, such as comparatives and passive voice, should be used.

Error-free sentences should be frequent, but a few errors can still achieve a Band 7.

The golden formula for Task 1 is 'describe and support', which helps make writing more logical and cohesive.

Vocabulary should show flexibility, using synonyms and less common words.

Cohesive devices, such as linking words and pronouns, should be used to link information.

Oceania shows minimal variation in urbanization rates, slightly declining by 2020 and expected to rise modestly by 2050.

The importance of getting numerical data correct to avoid reducing the task achievement score.

The sample answer provided is 238 words long, which is suitable for complex data sets.

For most tasks, students should aim for about 200 words.

Transcripts

play00:00

recently I asked our students what type of task  they received in recent exams in their Academic  

play00:07

Writing Task 1 and the most frequent answer was a  bar chart like this one a lot of data today I'll  

play00:17

show you how to write a band 8.5 answer step by  step how to meet real requirements examiner use  

play00:27

and we'll look at one thing most IELTS students  ignore but if you start using it in your Writing  

play00:35

your Task 1 answers will immediately get stronger  first let's read the task the chart below shows  

play00:45

the percentage of the population living in  urban areas in different regions the task one  

play00:51

instruction as always tells us to summarize the  information by selecting the main features and  

play00:58

make comparison where necessary we have data on  world averages and six regions covering three time  

play01:08

periods two in the past although 2020 is the most  recent set of data you can get so some people see  

play01:17

it as present and one in the future this task  demands more data analysis that most students  

play01:25

realize and that's why quite often it's task qu  one that drags the writing score down not task two  

play01:34

so let me show you the real requirements examiners  use from is band descriptors and how to write an  

play01:42

answer that will meet all of them one by one one  of the first requirements examiners use to assess  

play01:49

your tasks is this your answer presents a clear  overview the data are appropriately categorized  

play01:58

the main Trends or differences are identified so  what are the main Trends on our chart let's have  

play02:06

a look together I see one big Trend do you open  rights in most of the regions are going up Oceania  

play02:18

is the only exception because it went down a  little bit but generally it's pretty flat remember  

play02:24

we need to present a clear overview so this big  trend is what I'm putting there apart from Trends  

play02:33

you also need to make sure that information and  ideas are logically organized and there is a clear  

play02:40

progression so we need two or sometimes three body  paragraphs where we describe the data and you need  

play02:49

to organize the data in your body paragraphs  logically how would you do that there are  

play02:57

different ways here is mine feel free to comment  on yours in the comments the percentages in Africa  

play03:05

and Asia are lower and not too far from the world  so I'm putting them together Europe Latin America  

play03:13

and North America are much higher so that's my  second group what about Oceania well for me it's a  

play03:22

group of its own because it's very different from  the rest so I'm putting it in a separate paragraph  

play03:30

and this leads us to the following structure the  opening paragraph serves as an introduction and  

play03:36

giving an overview of the answer of the content  and the three body paragraphs we don't need a  

play03:45

conclusion in this task so save your time let's  go to our opening paragraph and check how well it  

play03:53

scores on our first Criterion task achievement  all we usually need is two sentences the first  

play04:02

describes what we see we can simply paraphrase the  task let's compare the two so the task says the  

play04:11

chart below shows the percentage it becomes  the chart illustrates the percentage of the  

play04:19

population living in urban areas becomes the rat  of urbanization in the world and in different  

play04:28

regions world wide and across six regions you  be probably short of time in task one so it's  

play04:36

important to say words here for example we don't  need to give a list of regions and then finally  

play04:44

in 1975 and in 2020 with a forecast for 2050  the second sentence gives the overview without  

play04:54

an overview you have no chance of a high band  score in task achievement my idea was to give  

play05:01

a general interpretation of the data pointing out  to our big Trend overall this is a typical opener  

play05:12

a marked Trend towards high oranization can be  seen almost universally across the globe although  

play05:21

variations in levels and rates are evident in  short we see that more and more people live in  

play05:29

cities in all the regions apart from Oceania  and that's why we say almost universally now  

play05:39

the body paragraphs where we describe the trends  and present the key features or the most important  

play05:46

numbers here is the first after our overview it  seems logical to begin with the world Rats from  

play05:54

1975 to 2020 Global urbanization increased from  under 40% to 56% and is expected to exceed 2/3  

play06:07

or 66% by 2050 now let's move to our regions and  the beginning of the period this rise has been  

play06:17

primarily driven by Asia and Africa which recorded  the lowest urban populations of around a quarter  

play06:26

in 1975 the next day in 2020 the figur stood at  50 and 43% respectively respectively is a great  

play06:38

word it means in the same order as mentioned so we  know that Asia was at 50% and Africa at 43 next by  

play06:48

2050 a further 15% increase is expected in these  regions which will still remain the least Urban  

play07:00

there is one important thing this paragraph  does although we're only describing Asia and  

play07:07

Africa we're also comparing them to other regions  recorded the lowest urban populations and will  

play07:16

still remain the least urbanized so that tells  us something about other regions even though  

play07:24

we haven't mentioned them why is it important  remember the task and make comparisons where  

play07:32

relevant comparatives the adjectives the lowest  or higher are also part of your grammar school  

play07:42

and they will help you with this requirement  to use a variety of complex structures what  

play07:49

other grammatical structures do we have well verb  tenses for example they're important because we're  

play07:57

switching from changes that happened in the past  increased stood recorded to present perfect to  

play08:05

describe the situation up to now has been driven  and changes predicted in the future is expected  

play08:14

will remain notice how the passive voice is used  is expected has been driven the latter has been  

play08:23

driven is the present perfect passive so if you  use it it will be quite impressive we also have  

play08:30

complex Clauses which recorded which will still  remain the examiner will notice these grammar  

play08:39

points and also check the number of mistakes we  have zero but for b seven you need to show that  

play08:47

error free sentences are frequent although a  few errors in grammar may pist so you can make  

play08:56

some mistakes and still get a seven the the former  examiner on our team gave this paragraph an eight  

play09:03

I know I'm mentioning all the requirements very  briefly but I have detailed lessons showing how  

play09:10

to select the key features on the first place  how to find Trends write an overview and so on  

play09:17

for each type of task and you can find all this in  my courses they can help you prepare for your exam  

play09:26

much more quickly and achieve a higher score I'll  link them below if you're interested but for us  

play09:33

it's time to move on to our second body paragraph  describing the next three regions and let's talk  

play09:42

about the one thing that can immediately improve  your writing not just one requirement your whole  

play09:50

task one score the problem with most task one  ansers is that they simply report all the numbers  

play09:58

this is fre competitive and not impressive at  all as far as examiners are concerned the golden  

play10:05

formula for task one is this I call it describe  and support it works for whole paragraphs and  

play10:13

individual sentences in terms of paragraphs each  body paragraph should have a logical sequence an  

play10:21

opening sentence that gives us the general idea  followed by one or more sentences that provide  

play10:28

details here is our general idea where I describe  in contrast North America Europe and Latin America  

play10:39

demonstrated some of the highest urbanization  rates and continue to grow I'll be slowly we're  

play10:48

explaining the data before giving the numbers  now support with some key features in 1975 around  

play10:57

34 of people in North America and 2/3 in Europe  lived in towns and cities while by 2020 the urban  

play11:07

populations had only gone up by approximately 10%  and some more about the future similar increases  

play11:16

are forecast for 2050 which means that North  America will remain the most urbanized region a  

play11:24

little comparison just below 90% now let me show  you the same described support approach within  

play11:33

one sentence describe Lettin America experienced  accelerated growth again we're saying what the  

play11:43

data means now support the numbers from just over  60% in 1975 to just over 80% in 2020 overtaking  

play11:55

Europe and will reach around 87% by 2015 if you  describe what the data means and support it with  

play12:04

some numbers you'll get a higher task achievement  score but it will also help you make your writing  

play12:12

more logical or cohesive and naturally encourage  you to use more varied vocabulary and grammar this  

play12:21

is so important speaking about vocabulary  have a look at this requirement when need  

play12:29

to show flexibility in other words combine words  together in a number of ways and use synonyms use  

play12:39

words precisely and to show we know some less  common words in atic Expressions less common  

play12:48

words are not some big rare words let's have a  look at some less common words in this paragraph  

play12:56

notice the verb demonstrate in instead of the more  common show or the verb forecast as an alternative  

play13:04

to expected or predicted overtake means to become  the highest notice too that growth was accelerated  

play13:16

perhaps the least common word here is obit which  means although and it's usually used to add a  

play13:25

short phrase or a word like here a I'll be slowly  we always need to mix the ways we use percentages  

play13:35

we see a bit of variation here for example 3/4  and 2/3 instead of 75% and 66% also in task one  

play13:47

we can give and should give approximations so  it's around 3/4 approximately 10% just below 90%  

play13:59

just over 60% and around 87% one other thing to  be careful of when we are writing about numbers  

play14:09

in any form is to get them right The Examiner  will notice any mistakes and can reduce your  

play14:17

score in task achievement as a result and  now we come to the Trier case when we have  

play14:23

the third body paragraph but first let's have  a look at this requir enironment we need to use  

play14:31

a range of cohesive devices linking words such  as however or in addition also pronouns they it  

play14:42

and substitution synonyms or something like this  region this trend okay let's read the paragraph  

play14:52

Oceania however shows minimal variation with  oranization rates slightly decl lining by 2020  

play15:01

and expected to rise modestly by 2050 maintaining  an average of around 70% speaking about cohesive  

play15:11

devices in this paragraph we see however to  contrast the information here with the previous  

play15:18

two and that's not unlike the body paragraph  two that begins with in contrast overall you  

play15:26

should use a variety of formal linkers in your  answer finally here is our task one answer 238  

play15:35

words with such a complex set of data it would  be hard to make it shorter but for most other  

play15:42

tasks and most students add a for about 200  words and you can download the sample answer  

play15:51

below and if this lesson seem tough I'd recommend  learning more about different part of the report  

play15:59

how to write an overview or how to make  comparisons uh how to select the key  

play16:05

features and so on and right now you can watch  this indepth lesson on how to write a perfect  

play16:12

introduction this is a free preview of our  courses and the courses themselves are linked  

play16:19

in the description and don't forget to use the  formula describe and support in your answers bye

Rate This

5.0 / 5 (0 votes)

Related Tags
IELTS TipsAcademic WritingTask 1 GuideBand 8.5 AnswersData AnalysisWriting TechniquesUrbanization TrendsIELTS Exam PrepEssay StructureVocabulary Use