Microsoft Excel 2019 - Full Tutorial for Beginners in 17 MINUTES!

Skills Factory
23 Nov 201817:15

Summary

TLDRThis tutorial introduces Microsoft Excel 2019, covering its features for data organization, calculations, and visualization. It guides users through starting a new workbook, navigating cells, formatting text, and managing rows and columns. The video also explains cutting, copying, and pasting data, using formulas for calculations, and importing external data. Additionally, it covers adding objects like images and shapes, creating tables and charts, and exporting data. The tutorial aims to equip viewers with essential Excel skills.

Takeaways

  • πŸ’Ό Excel is a powerful tool for data organization, calculations, and visualization.
  • πŸ–₯️ Excel 2019 is compatible with Windows 10 laptops and Mac computers with Office for Mac.
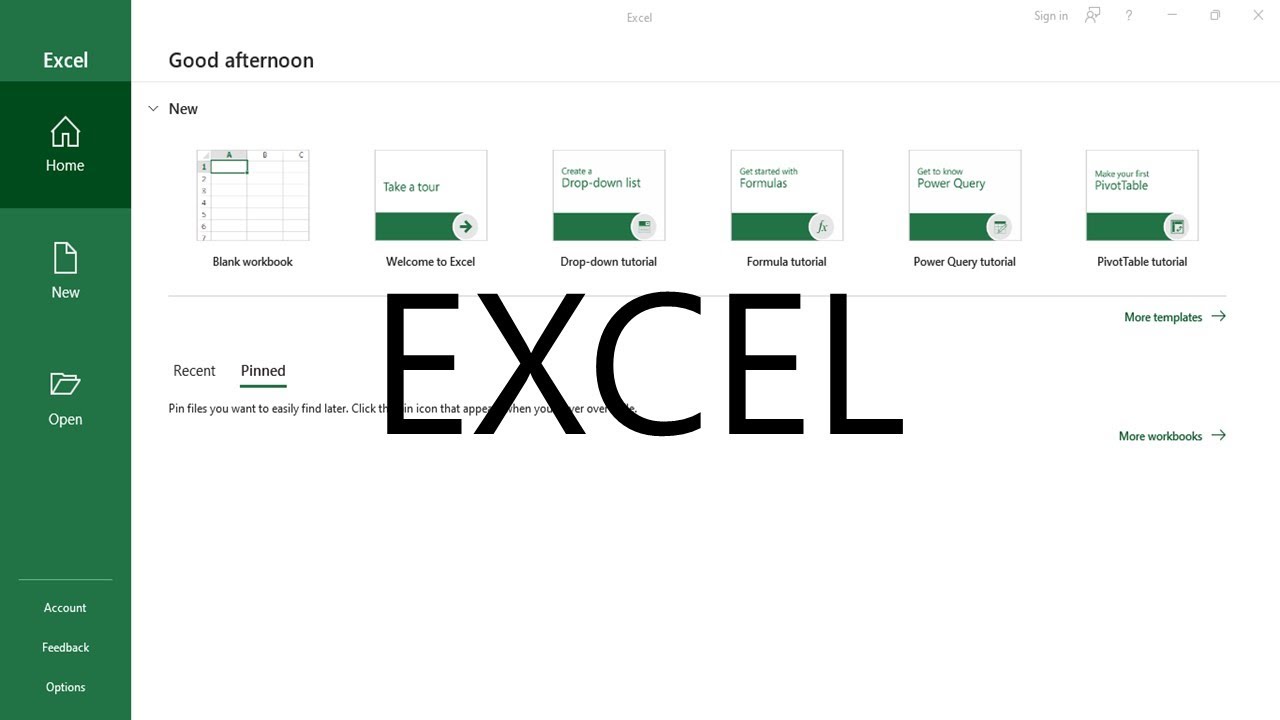
  • πŸ“Š The software opens with a start page featuring recent documents and ready-made templates.
  • πŸ“‘ A new Excel Workbook appears as an empty table with columns and rows that extend as needed.
  • πŸ”’ Cells can contain data and are the basic units for inputting titles, notes, or numbers.
  • πŸ“ Columns and rows can be adjusted, and changes affect all cells within them.
  • πŸ”„ Copy, cut, and paste operations are fundamental for moving data within a workbook.
  • πŸ–ŒοΈ The Home tab allows editing and managing the appearance of cells, including font and alignment.
  • πŸ“ˆ Excel offers extensive formula functionality for calculations and data manipulation.
  • πŸ“Š Charts and tables can be created for visual data representation, with customization options.
  • πŸ’Ύ Workbooks can be saved in various formats, including .xlsx, .csv, .txt, and .pdf.

Q & A

  • What is Microsoft Excel 2019 and what is its primary function?

    -Microsoft Excel 2019 is a professional software developed by Microsoft, belonging to the Office suite. Its primary function is to collect, organize data, make calculations, and create tables and charts for visual data representation.

  • On which operating systems does Excel 2019 work?

    -Excel 2019 works on laptops with Windows 10 and on all Mac computers that have the 'Office for Mac' version installed.

  • What is displayed on the start-up page of Excel when it is opened?

    -The start-up page of Excel displays recent Excel documents (Workbooks) on the left side and several ready-made templates on the right side for starting a new document.

  • How do you start a new empty document in Excel?

    -To start a new empty document in Excel, you can select 'Blank workbook' from the start-up page.

  • What are the basic components of an Excel Workbook?

    -An Excel Workbook consists of a grid of columns named with letters and rows numbered with numbers, forming cells that can contain data. It also includes a Menu bar with various tabs for features and tools, and pages (Sheets) at the bottom.

  • How do you select and edit the content of a cell in Excel?

    -To select a cell, click on it, which highlights its borders in green. Double-click to start typing inside the cell. You can type text or numbers. To remove content, select the cell and use the Backspace key.

  • What happens if the text in a cell is too long to fit?

    -If text is too long, it will overlap the next cell. This can be resolved by dragging the column edges to expand the width or by using the Wrap Text feature to extend the row height to fit the text content.

  • How can you manage cells, such as cutting and pasting their content?

    -To cut a cell, select it and use CTRL+X (or CMD+X on Mac). Then, select another cell and use CTRL+V (or CMD+V) to paste the content. This operation is often used to move content between cells.

  • How do you handle text alignment and orientation in Excel cells?

    -Text alignment and orientation can be adjusted in the Alignment section under the Home tab. You can align text to the left, right, or center, and use Orientation to change the text inclination.

  • What is the purpose of the Merge & Center feature in Excel?

    -The Merge & Center feature is used to merge multiple cells, series, or tables together. The merged cell can be customized, and its content is centered according to the alignment options.

  • How can you import external data into Excel?

    -You can import external data by going to the Data tab and selecting Get Data. Excel supports importing from Excel Workbooks, .csv, .txt files, or from the internet. For .csv files, Excel provides a preview with delimiter options.

  • How do you create a formula in Excel and what is a live calculation?

    -To create a formula, type an equals sign followed by the first argument and operation. Press Enter to calculate. A live calculation updates the result immediately as the numbers in the cells change.

  • What are some ways to add visual elements to an Excel Workbook?

    -You can add visual elements like images, shapes, and icons by using the Insert tab. These objects can be independently edited for movement, scaling, and rotation.

  • How do you create a chart in Excel and what elements does it consist of?

    -To create a chart, select the data table and choose a template from the Charts section in the Quick Analysis dialog box. A chart consists of the Plot Area, which shows the data visually, and Chart Elements, such as titles, axes, gridlines, and legends.

  • How can you save and export your Excel Workbook in different formats?

    -To save and export your Workbook, go to File and then Save As..., choose the location, file name, and file type. You can save as an Excel Workbook (.xlsx), export as a database (.csv or .txt), or save for printing as a PDF.

Outlines

00:00

πŸ“Š Introduction to Microsoft Excel 2019

This paragraph introduces viewers to Microsoft Excel 2019, emphasizing its role as a professional tool for data collection, organization, and visualization. It covers the software's compatibility with Windows 10 laptops and Mac computers with 'Office for Mac'. The video script guides viewers on starting a new document, navigating the interface, and understanding the basic components like cells, rows, columns, and the menu bar. It also explains how to manipulate cells, including typing, formatting, and cutting/pasting content. The importance of using the correct decimal separator based on system language is highlighted to ensure data is saved correctly.

05:04

πŸ”„ Cell Management and Data Import

Paragraph 2 delves into advanced cell management techniques such as selecting multiple cells, cutting and pasting cell series, and deleting cell content. It introduces the Home tab's features for editing cell appearance, including font settings and alignment options. The paragraph also covers merging cells, adding borders, and using Excel's data manipulation tools like the fill handle and importing external data from various sources. Formulas are introduced as a way to perform calculations, with a guide on how to input and use them effectively, including live updates and function suggestions.

10:10

πŸ–ΌοΈ Enhancing Workbooks with Objects and Charts

This section teaches viewers how to enhance their Excel workbooks with additional objects like images, shapes, and icons. It explains how to insert and manipulate these objects using the Insert and Format tabs. The paragraph also covers creating tables and charts for data visualization. It details the process of using the Quick Analysis icon, formatting tables, and selecting chart types. The video script provides instructions on customizing charts, including editing chart elements, styles, and data series, to create professional and visually appealing data representations.

15:14

πŸ’Ύ Saving and Exporting Workbooks

The final paragraph focuses on saving and exporting Excel workbooks. It instructs viewers on how to save their work in various formats, including .xlsx for future editing, .csv or .txt for exporting data without visual content, and .pdf for printing purposes. The paragraph concludes by encouraging viewers to explore more video tutorials on Microsoft Office 2019 for further learning.

Mindmap

Keywords

πŸ’‘Excel

Excel is a widely-used spreadsheet program developed by Microsoft, which is part of the Microsoft Office suite. It is designed for creating and managing spreadsheets, performing calculations, and analyzing and visualizing data. In the context of the video, Excel is the main subject, with the tutorial focusing on how to use Excel 2019 effectively for data collection, organization, and visualization.

πŸ’‘Workbook

A Workbook in Excel refers to a file that contains one or more Sheets, which are used for organizing and storing data in a tabular format. Workbooks are the primary means of working with data in Excel. The script mentions opening a new Blank workbook as a starting point for using Excel, indicating that it's where users begin their data management tasks.

πŸ’‘Cells

Cells are the individual units within a spreadsheet that can contain data such as numbers, text, or formulas. They are defined by their column letter and row number. The script explains how to select, type into, and manipulate cells, which is fundamental to interacting with data in Excel.

πŸ’‘Formulas

Formulas in Excel are mathematical equations that perform calculations on the data within cells. They begin with an equals sign '=' and can include functions, operators, and cell references. The video script describes how to input formulas to make calculations, which is essential for analyzing data in Excel.

πŸ’‘Charts

Charts in Excel are visual representations of data that can help users understand patterns, trends, and insights. The script discusses creating charts from selected data, which is a way to turn raw data into a more digestible and informative format.

πŸ’‘Templates

Templates in Excel are pre-designed workbooks with formatting and sometimes data that users can start from to create new documents. The script mentions that Excel offers ready-made templates to start with a new document, which can save time and ensure consistency.

πŸ’‘Data Import

Data Import refers to the process of bringing data from external sources into Excel. The script explains how to import data from various formats such as .csv or .txt files, or from the internet, which is crucial for working with existing datasets in Excel.

πŸ’‘Functions

Functions in Excel are pre-built formulas that perform specific calculations and operations. The script describes how to use functions in formulas, which can simplify complex calculations and make data analysis more efficient.

πŸ’‘Tables

Tables in Excel are structured collections of data that can be formatted and managed with ease. The script mentions creating tables from selected cells, which helps in organizing data and applying consistent formatting and calculations.

πŸ’‘Cut, Copy, and Paste

These are fundamental operations in Excel for moving or duplicating data. The script explains how to use these operations on cells or entire rows and columns, which are essential for data manipulation and organization.

πŸ’‘Merge & Center

Merge & Center is a feature in Excel that combines two or more adjacent cells into a single cell and centers the content within it. The script uses this term to describe how to combine cells for creating unified headings or titles, which is useful for improving the readability and presentation of data.

Highlights

Introduction to Microsoft Excel 2019

Excel is a professional software for data collection, organization, and visualization

Excel 2019 is available on Windows 10 laptops and Mac computers with Office for Mac

The start-up page shows recent documents and ready-made templates

A new Excel Workbook appears as an empty table with columns and rows

Cells can contain numbers or text and are selected by clicking

Text can be edited and formatted within cells

Column and row adjustments affect all cells within them

Decimal separators change based on system language

Cells can be cut, copied, and pasted using keyboard shortcuts

Undo actions with CTRL+Z or CMD+Z

Rows and columns can be deleted and inserted

Multiple cells can be selected and manipulated

The Home tab allows editing and managing cell appearance

Cells can be merged and customized

Borders can be added to cells

Excel offers tools to copy cell content and import external data

Formulas are used for calculations and can be found in the Formula Library

Objects like images, shapes, and icons can be added to a Workbook

Text boxes can be used to add text to a Workbook

Quick Analysis provides options for formatting and visual analysis

Tables can be created and customized in Excel

Charts are visual representations of data and can be created from tables

Chart Elements can be edited and customized

Workbooks can be saved and exported in various formats

Transcripts

play00:06

Hello there, welcome to this video! Let's discover in a short time all

play00:12

the main features you need to know to start using Microsoft Excel 2019!

play00:18

Leave us comments and suggestions below this video to improve our next

play00:22

video tutorials dedicated to Microsoft Excel!

play00:27

Excel is a professional software belonging to Office, developed by

play00:32

Microsoft. This is the most complete and the most used product to

play00:37

collect and organize data, make calculations and realize tables and

play00:43

charts, in order to get a visual representation of your data.

play00:47

This 2019 Release works just on laptops with Windows 10, and on all

play00:53

Mac computers having the 'Office for Mac' version.

play00:58

When opening Excel a start-up page opens, showing your recent Excel

play01:03

documents (or Workbooks) on the left side, and several ready-made

play01:09

templates on the right, used to start with a new document.

play01:14

In order to see how to use Excel, let's just start from a new empty

play01:18

document by going to Blank workbook.

play01:23

The Excel Workbook shows up as a big empty table, with several columns

play01:29

named with letters, and rows with numbers. These get extended as you

play01:34

need while working on your document. Columns and rows together divide

play01:41

the document into cells, which can contain numbers or text.

play01:48

On top you have the Menu bar, divided in several tabs, collecting all

play01:53

the features and tools to work inside Excel. At the bottom you find all

play02:00

the pages (or Sheets) composing your Workbook. You can add new pages by

play02:05

using the plus button, and rename, color or delete a page by

play02:11

right-clicking on it.

play02:16

Let's see how to work with cells. These are used singularly to type

play02:21

titles, notes or numbers, or taken in series along a column or a row to

play02:27

collect a large amount of data.

play02:31

Click on a cell to select it. This will get its borders highlighted

play02:36

in green color, and its name on the Name Box in the top left corner.

play02:41

Double-click on the cell to start typing inside. You can type in text,

play02:47

in order to write titles and description on rows and columns, or leave

play02:53

numbers to start making calculations.

play02:56

To remove any content from the cell, just select it and use the

play03:01

Backspace key.

play03:03

In case text is too long, this will overlap the next cell. You can

play03:09

solve this by clicking and dragging its column edges, until the whole

play03:14

text is fully contained. You can also use Wrap Text to extend the row

play03:20

height until it fits the text content. Consider that any modification

play03:26

applied to columns and rows will also affect all the cells belonging to

play03:30

these.

play03:32

Pay attention when adding decimals: the separator changes according to

play03:37

the system language you use. For example, if your language is English,

play03:43

and you use a dot, the cell saves the value as a number correctly,

play03:48

showing a right alignment. If you use a comma, the value is written as

play03:53

text, with a left alignment on the cell.

play03:58

Now, let's see how to manage the cells. To cut a cell, just select it

play04:05

and use CTRL+X (or CMD+X for Mac). This shows a green dashed contour.

play04:15

Then, if you select another cell, and use CTRL+V (or CMD+V), you will

play04:22

paste the cut content on the new cell. This cut-paste operation is

play04:28

often used to move content between cells.

play04:33

If you make any mistake, just use CTRL+Z (or CMD+Z) to undo your last

play04:42

action.

play04:43

You can also cut, copy and paste an entire row or column content by

play04:49

clicking on its letter or number, and then right-clicking on it. You

play04:56

can also use Delete to remove the content, and Insert to add a new

play05:03

empty column or row by shifting everything aside.

play05:09

If you click and drag on the cells, you can select a series of cells

play05:14

along a column or a row, or even a table. Once these are selected, you

play05:20

can cut and paste these as seen for single cells. When you paste, the

play05:26

first cell over a white background is taken as reference.

play05:32

To remove content from multiple cells, just right-click and go to

play05:37

Delete..., and choose whether to shift the existing cells or to remove

play05:42

the whole columns and rows interested.

play05:46

With the Home tab above you can edit and manage the appearance of the

play05:51

cells, series and tables you have selected on the Workbook.

play05:56

Under the Font section you can change the font family, size, style,

play06:02

color with Font Color, and add fill with Fill Color.

play06:09

Inside Alignment, you can adjust the text distribution to the left,

play06:14

right, or make it centered. Use Orientation to change the text

play06:19

inclination as you like.

play06:23

For additional text and cell properties, just click on Font Settings

play06:28

or Alignment Settings.

play06:30

You can use Merge & Center to merge multiple cells, series or tables

play06:36

together.

play06:38

The merged cell can be customized just as seen for standard cells. As

play06:46

you type in, the content is placed at the bottom, according to the

play06:50

alignment options located on the Home tab. Here you can switch to

play06:55

Middle or Top Align.

play06:59

If you merge cells with content, just the content of the white cell is

play07:04

saved and extended to the others. To unmerge, just click again on Merge

play07:11

& Center.

play07:13

You can also add borders to your cells by using the Border button.

play07:19

When you select multiple cells, you can fill the external sides of the

play07:23

whole selection by using Bottom, Top, Left, Right and Outside Borders.

play07:32

To add borders within the selection, use All Borders. This respects the

play07:38

cells that are merged or unmerged.

play07:42

Excel offers several tools to work with your data!

play07:46

When selecting one or multiple cells you get a green node in the

play07:50

bottom right corner. If you click and drag it along the column or row,

play07:56

you will copy the cell content on all the cells selected in this way.

play08:01

If you drag on the other way, you remove all the copies quickly.

play08:08

Inside Excel you can also import external data in several formats.

play08:14

If you go to Data, and then to Get Data, you can import files from

play08:19

Excel Workbooks, any .csv or .txt file, or from the internet. When

play08:28

importing a .csv file, Excel shows a preview of it, according to the

play08:34

Delimiter option chosen at the top. When you click on Load, a new

play08:40

Sheet is created with the whole data imported from the .csv file.

play08:48

You can use the Formulas to make math and calculations with your data.

play08:53

When typing into a cell, introduce an equals sign to start with a

play08:58

Formula. Then add the first argument by typing the number or the cell

play09:04

name that contains the value interested. Introduce the operation, such

play09:10

as plus (+) for additions, minus (-) for subtractions, an asterisk (*)

play09:15

for multiplications, and a slash (/) for divisions. When you finish

play09:21

importing arguments and operations, use the Enter key to calculate.

play09:26

This remains a live calculation: as the numbers inside the cells

play09:31

change, the result will be updated immediately.

play09:36

Excel collects a very large amount of Formulas you can use. As you

play09:41

insert the equals sign, type any letters to get a full list of functions

play09:46

that match them. You can click on a function to get tips about it, and

play09:52

double-click on it to insert it on the cell. Excel also suggests how

play09:58

you to complete the Formula: some of these require a single argument

play10:02

(such as any number or cell), some others a list of arguments. These can

play10:09

be single cells or entire series, represented by the first and the last

play10:17

cell of the series, divided by a double dot. Use the Enter key to

play10:22

apply. You can check the expression used on the selected cell from the

play10:28

Formula bar on top.

play10:31

In addition, you can check the Function Library section under Formulas,

play10:36

to get the full list of functions available.

play10:40

Inside Excel you can also add extra objects, such as images, shapes and

play10:46

icons to make your Workbook clearer. Inside the Insert tab, use Pictures

play10:53

to import a picture; Shapes to drop arrows and regular shapes by

play11:00

clicking and dragging; and Icons to drop icons. All these objects can

play11:09

be edited independently. You can move by clicking and sliding these;

play11:15

scale by using their nodes, and rotate by using their top arrow.

play11:22

In addition, you can use the Format tab to edit the object appearance,

play11:27

for example to set its Fill; add and edit its Outline, deciding color,

play11:35

line style and thickness, or add any effect.

play11:42

Within the list of the shapes, you can use Text Box to add pieces of

play11:47

text. Just click and drag on the Workbook to drop the text borders

play11:53

and then type inside. This box can be moved, scaled and

play11:58

rotated just like any other object.

play12:02

Use the Home tab to adjust the text properties and color, and the

play12:08

Format tab to add Fill or Outline to both the text box and the text

play12:15

characters inside.

play12:18

Now, let's see how to create tables and charts with your data!

play12:23

As you select a series or tables of cells, the Quick Analysis icon shows

play12:29

up, with several quick options and operations you can apply.

play12:34

Under Formatting and Sparklines you can add immediate visual analysis

play12:39

on the selected data. You can hover over the samples to get a preview,

play12:44

and click on these to apply.

play12:47

Under Totals, you can make quick operations on each column or row

play12:52

selected.

play12:53

Under Tables, you can go to Table to create a formatted table, with

play12:59

colors and titles set. You can adjust its appearance by using the

play13:03

Design tab above, and extend it by using its node in the bottom right

play13:09

corner. To remove the table, just select it all, right-click and go to

play13:16

Clear Contents.

play13:18

Excel has advanced and professional tools to make charts, which are

play13:23

visual representations of your data.

play13:26

To create charts, just select the table collecting your data, and go to

play13:31

Charts inside the Quick Analysis dialog box to pick a ready template

play13:37

from the list. You can go to More... and then to All charts for the

play13:43

full list of templates available on the left, complete with their

play13:47

preview on the right. When you select one and go to OK, the chart shows

play13:53

up as an independent object, that you can move and scale as seen for

play13:58

other objects.

play14:00

This chart is made by several parts: the Plot Area, with the visual

play14:05

representation of your data, and the Chart Elements, which are all the

play14:10

items around it, such as titles, axes, gridlines and legends. Each of

play14:16

these objects can be moved and scaled within the chart. You can also

play14:23

type inside the titles and edit their properties by using the Home tab.

play14:30

Use the Format tab to adjust the Fill, the Outline and add any Effect

play14:36

on the Chart Element selected.

play14:39

Next to the chart you have three buttons. Use Chart Elements to show

play14:44

or hide any element; Chart Styles to change the chart template to use;

play14:51

and Chart Filter to enable or disable any of the series shown on the

play14:56

Plot Area. To change the chart type, just go to Change Chart Type under

play15:04

the Design tab.

play15:07

To manage the series inside the Plot Area, just go to Select Data under

play15:13

the Design tab. The dialog box shows the list of all the series inside

play15:19

the chart on the left, that you can edit by selecting one and going to

play15:24

Edit.

play15:25

Under Series name, type its name (which is shown on the legend), and

play15:32

under Series values insert the column or the row collecting its data by

play15:38

clicking on the arrow icon and selecting directly from the Workbook.

play15:44

Use Add and Remove to add new series or remove the one selected.

play15:52

If you double-click on the chart, you will open the right panel, used

play15:57

to edit the chart appearance in detail, such as the series properties,

play16:03

the axes range, or the Plot Area options.

play16:08

To save and export your Workbook, go to File, and then to Save As...,

play16:15

choosing where to save it. Then, type the file name and, as file type,

play16:21

choose .xlsx to save your work as an Excel Workbook, to open and edit

play16:28

it later; .csv or .txt to export the content as a database, excluding

play16:37

any visual content; or choose .pdf to print your Workbook as it is.

play16:45

Thanks for watching this video! Visit our channel for more free and

play16:49

outstanding video tutorials for Microsoft Office 2019!

Rate This
β˜…
β˜…
β˜…
β˜…
β˜…

5.0 / 5 (0 votes)

Related Tags
Excel 2019Data AnalysisMicrosoft OfficeWorkbookChart CreationFormula FunctionsCell ManagementData ImportTable DesignVisual Tools