How The Mother Of All Market Rallies Would End | Chris Vermeulen

David Lin
25 Mar 202434:01

Summary

TLDRIn this financial discussion, the participants delve into market patterns, retracements, and potential corrections. They explore the use of Fibonacci extensions and retracements to predict market movements and discuss the current state of various assets, including stocks, gold, Bitcoin, and real estate. The conversation highlights the importance of understanding market trends and being mentally prepared for potential shifts. The guests share their strategies for navigating the markets, emphasizing the significance of risk management and the ability to adapt to changing conditions.

Takeaways

  • ๐Ÿ“‰ Markets often exhibit patterns of correction to certain levels or percentages, such as 38%, 50%, or 68% retracements.
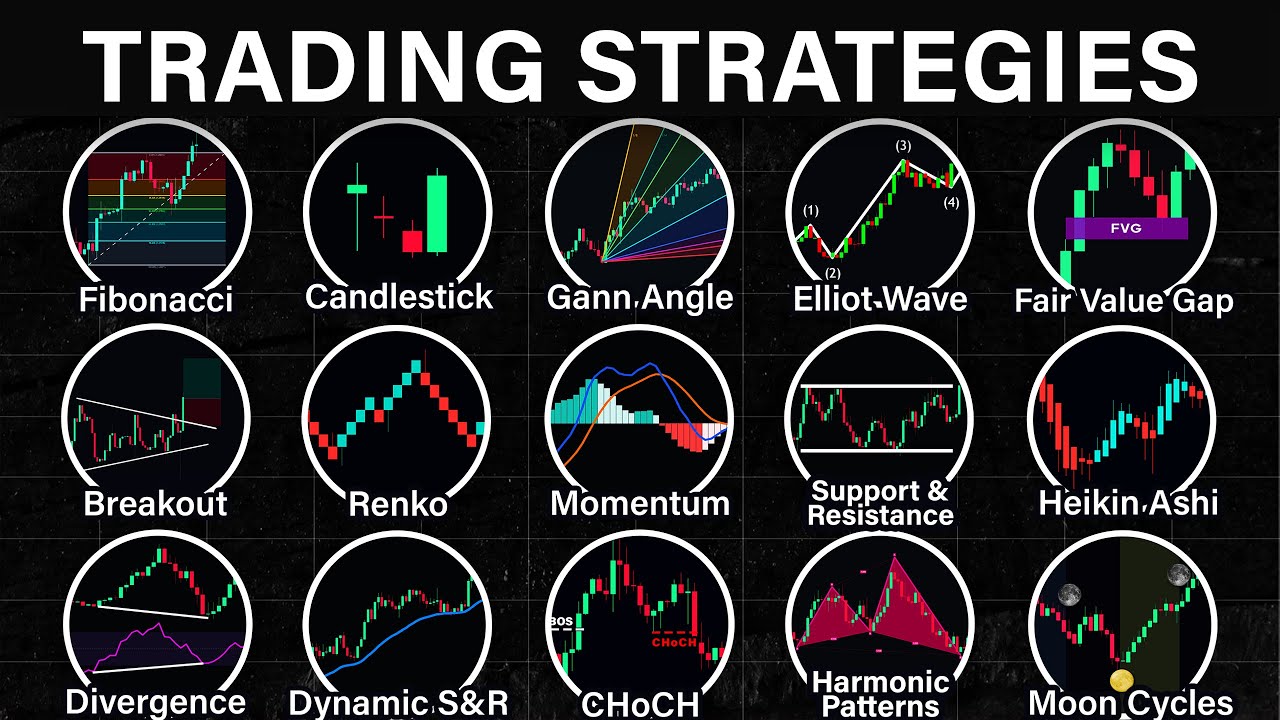
  • ๐Ÿ“ˆ The use of Fibonacci extensions and retracements can help determine potential market momentum and selling pressure.
  • ๐Ÿ’น Despite general market optimism, not all sectors are performing well, with small-cap stocks lagging behind tech-heavy indexes.
  • ๐Ÿ”„ The concept of market rotation suggests that money flows from one asset class to another, impacting overall market trends.
  • ๐Ÿ“Š Technical analysis, including trend following, can provide insights into market strength and potential turning points.
  • ๐Ÿ“ˆ Some assets, like gold and Bitcoin, have shown the tendency to reach new all-time highs, but history shows they often face significant corrections.
  • ๐Ÿ  The real estate sector, including home builders and related industries, may be facing a high-risk period due to market over้ฅฑๅ’Œๅ’Œ and potential slowdown.
  • ๐Ÿ’ฐ A balanced portfolio strategy involves holding cash and assets, adjusting based on market conditions and risk tolerance.
  • ๐ŸŒ Global economic factors, such as central bank policies and currency movements, can influence market directions and investor sentiment.
  • ๐Ÿ”ฎ Seasonality patterns in the stock market suggest potential market stalls or declines after May, based on historical averages.

Q & A

  • What does the speaker suggest about market patterns and corrections?

    -The speaker suggests that markets do exhibit patterns and often correct to certain levels or percentages, such as 38%, 50%, or 68% of the initial rally. Fibonacci retracement is a method used to predict these corrections.

  • How does the speaker view the current state of the stock market?

    -The speaker believes that while certain indexes like the NASDAQ and S&P 500 may appear to be hitting new all-time highs, a deeper analysis reveals that many sectors are struggling and the market is in a topping phase, potentially leading to a significant correction.

  • What is the speaker's stance on small-cap stocks?

    -The speaker is not optimistic about small-cap stocks, specifically the Russell 2000, as it is currently at a major resistance area andไป–่ฎคไธบ it is part of a false rally.

  • What does the speaker think about the role of technical analysis in trading?

    -The speaker values technical analysis for its ability to identify trends, power, and strength behind market moves, and to understand money flows between different asset classes. It helps in following the market trend and making informed decisions.

  • What is the speaker's view on the potential for a market correction in the future?

    -The speaker is bearish on the market in the long term and believes that a significant correction is likely, possibly starting as a topping phase, but still sees potential for short-term rallies.

  • How does the speaker approach asset allocation in his strategy?

    -The speaker follows an asset rotation strategy, focusing on owning one asset at a time that is moving up and in favor of their risk tolerance, while also holding a portion of the portfolio in cash or short-term treasury notes for safety and income.

  • What is the speaker's opinion on the current performance of real estate and related sectors?

    -The speaker is bearish on real estate, believing that the market is softening and that sectors like home builders and lumber are at risk of a significant downturn.

  • How does the speaker use Fibonacci extension and retracement in his analysis?

    -The speaker uses Fibonacci extension to identify potential upside momentum and Fibonacci retracement to predict selling pressure and market corrections. These tools help to determine potential support and resistance levels.

  • What is the speaker's view on Bitcoin's recent performance?

    -The speaker is cautious about Bitcoin's parabolic rise, viewing it as a fear-based rally driven by FOMO. He notes that such sharp upward movements are often followed by significant corrections.

  • What does the speaker suggest about the US dollar trade?

    -The speaker expresses interest in a potential US dollar trade, as he observes that the US dollar is slowly building a base on the monthly chart, which could indicate an upcoming bullish movement.

  • What is the speaker's strategy for managing market risks?

    -The speaker's strategy involves being mentally prepared for potential market outcomes, managing positions carefully, and not trying to predict tops or bottoms. He emphasizes the importance of staying with the trend until it clearly reverses.

Outlines

00:00

๐Ÿ“ˆ Market Patterns and Corrections

The paragraph discusses the patterns and habits of market corrections, referencing Fibonacci extensions and retracements to predict potential market behavior. It highlights the importance of understanding market momentum and selling pressure to anticipate pullbacks and identifies key levels such as 38%, 50%, or 68% of the initial rally. The speaker uses the S&P 500 futures as an example to illustrate potential market pullbacks and discusses the timing of buying, selling, or holding assets at market tops.

05:01

๐Ÿ“Š Market Sentiment and Resistance

This section delves into the sentiment and resistance levels in the market, emphasizing that not all sectors are performing equally. It discusses the disparity between tech-heavy indexes like the NASDAQ and the S&P 500 and broader market indicators like the equal-weighted S&P 500 and Russell 2000. The speaker argues that the market is in a topping phase, with a false sense of a rally driven by complacency and a few big tech companies, rather than a broad-based market strength.

10:02

๐Ÿค” Short-Term Bullish vs. Long-Term Bearish Stance

The speaker shares his nuanced stance on the market, being short-term bullish but long-term bearish. He explains that despite a positive outlook on the market for the next few weeks, he anticipates a significant market downturn later in the year. This perspective is based on technical analysis, intermarket analysis, and the observation of market trends and money flows. The speaker emphasizes the importance of not trying to time the market but instead following the trend and adjusting positions based on technical signals.

15:03

๐Ÿ“ˆ Analyzing Nvidia's Chart and Market Dynamics

The focus shifts to an analysis of Nvidia's stock performance, using Fibonacci extension as a tool to identify potential upside targets. The speaker discusses the company's strong fundamentals and its position in the AI space, suggesting that it could defy broader market corrections. The conversation also touches on the potential overreach of AI in various industries and the importance of being mentally prepared for market seasonality and potential corrections.

20:07

๐Ÿ“‰ Predicting Market Corrections and Key Levels

The discussion continues with predictions of market corrections, using Fibonacci retracement to estimate potential pullback levels based on historical data. The speaker considers the possibility of a significant market correction, potentially reaching levels near the COVID lows. The conversation also includes an analysis of gold, silver, and miners, suggesting that these sectors may be indicative of a market turning point as investors rotate into these assets.

25:07

๐Ÿš€ Bitcoin's Parabolic Rise and Market Behavior

The speaker expresses caution about Bitcoin's parabolic rise, suggesting that such sharp increases are often followed by significant corrections. He discusses the fear, uncertainty, and greed (FOMO) that drive market behavior, particularly in the context of cryptocurrencies. The speaker notes historical patterns where Bitcoin has corrected after reaching new all-time highs and cautions that the current trend may be due for a similar pullback.

30:08

๐Ÿ  Real Estate Market Outlook and Risk Assessment

The conversation turns to the real estate market, with the speaker expressing a bearish outlook due to signs of softening in the sector. He discusses the risks associated with the current market sentiment and the potential for a significant downturn in the housing market. The speaker also touches on related sectors like home builders and the lumber industry, suggesting that they may face challenges as the housing market slows down.

๐Ÿ’ก Strategy Update and Market Positioning

The speaker provides an update on his investment strategy, revealing a 50/50 split between the stock market and cash. He explains that this position reflects a combination of remaining bullish on the stock market while also being prepared for potential corrections. The speaker's strategy focuses on asset rotation, holding one asset at a time that is moving up and in favor of risk tolerance, while also maintaining a cash position for safety and opportunity.

Mindmap

Keywords

๐Ÿ’กMarket Correction

A market correction refers to a decline in the price of stocks or other assets, typically by a significant percentage, after a period of sustained increases. In the video, the speaker discusses the possibility of a market correction based on historical patterns and technical analysis, such as Fibonacci retracement levels. The speaker mentions potential pullbacks to certain levels, like 38%, 50%, or 68% of the initial rally, indicating a reversion towards the mean or a consolidation phase after a strong upward trend.

๐Ÿ’กFibonacci Retracement

Fibonacci retracement is a technical analysis tool used to identify potential support and resistance levels in the price action of a stock or other traded assets. It is based on the Fibonacci sequence, where significant numbers like 38.2%, 50%, and 61.8% are used to predict the extent of a correction or rally. In the video, the speaker uses Fibonacci retracement to estimate how much the market might pull back after a rally, suggesting that the market likes to retrace to these key Fibonacci levels.

๐Ÿ’กAsset Allocation

Asset allocation is the process of dividing an investment portfolio among different asset categories, such as stocks, bonds, and cash. The goal is to balance risk and reward by distributing investments across various asset classes. In the video, the speaker discusses their strategy of being long on the stock market and having a portion of the portfolio in cash, reflecting a balanced approach to managing risk in anticipation of a potential market correction.

๐Ÿ’กTechnical Analysis

Technical analysis is a trading discipline employed to evaluate investments and identify trading opportunities by analyzing historical price activity, primarily through the use of charts and statistical tools. It is based on the premise that historical price movements tend to repeat themselves, and by studying these patterns, traders can predict future price movements. In the video, the speaker uses technical analysis to identify trends, support and resistance levels, and potential market corrections or rallies.

๐Ÿ’กMarket Sentiment

Market sentiment refers to the overall attitude or feeling of investors toward a particular security or financial market. It can be broadly categorized as positive, negative, or neutral and is often used to gauge the likelihood of a bullish or bearish market. In the video, the speaker discusses how market sentiment can influence investor behavior, such as the fear of missing out (FOMO) leading to parabolic rallies and subsequent corrections.

๐Ÿ’กSector Performance

Sector performance refers to the overall market performance of a specific group of stocks that share a common business or industry. Sectors are often categorized based on economic segments like technology, finance, healthcare, and energy. In the video, the speaker discusses the varied performance of different sectors, highlighting that while some may be struggling, others like technology stocks may be hitting new highs.

๐Ÿ’กReal Estate Market

The real estate market refers to the economic sector involving the buying, selling, and development of land and property. It includes various types of properties such as residential, commercial, and industrial real estate. In the video, the speaker expresses a bearish view on the real estate market, citing signs of softening and potential risks for investors who are overly bullish on the sector.

๐Ÿ’กStock Market Indices

Stock market indices are statistical measures of the performance of a segment of the stock market. They are often used as proxies for the overall health and performance of the market. Well-known indices include the S&P 500, NASDAQ, and Dow Jones Industrial Average. In the video, the speaker discusses being long on stock market indices, particularly the S&P 500 and NASDAQ, as part of their investment strategy.

๐Ÿ’กComplacency

Complacency in a financial context refers to a state of overconfidence or lack of concern among investors, often leading to risky behavior and potential market bubbles. It is characterized by a belief that good times will continue indefinitely, ignoring potential warning signs of a downturn. In the video, the speaker warns about the dangers of complacency in the market, suggesting that it can lead to investors missing signs of an impending correction.

๐Ÿ’กTrend Following

Trend following is an investment strategy that involves identifying and following the direction of the market trend, whether up or down, and remaining in that position as long as the trend continues. It is based on the idea that trends persist and can provide profitable opportunities for traders. In the video, the speaker emphasizes their trend-following strategy, which involves staying invested in the market as long as the trend is upward, and only exiting when the trend reverses.

Highlights

Markets often exhibit patterns or habits of correcting to certain levels or percentages, such as Fibonacci retracement levels.

Fibonacci extension can be used to determine the potential momentum to the upside in market movements.

The market has a tendency to pull back to sweet spots like 38%, 50%, or 68% of the initial rally.

The sell signal or market top can be identified by observing asset behavior and market sentiment.

The current market situation is not uniform, with tech-heavy indexes like the NASDAQ and S&P 500 showing strength, while others like the Russell 2000 are struggling.

The perception of a market reaching new all-time highs can be misleading, as it may mask underlying weaknesses in various sectors.

Small-cap stocks lagging may not necessarily indicate a good buying opportunity, as market trends and technical analysis should be considered.

The false sense of market strength can lead to complacency among investors, potentially setting the stage for a significant correction.

Technical analysis, including intermarket analysis, can provide insights into the strength behind market moves and potential trends.

Trend following is a key strategy in navigating the market, avoiding the pitfalls of trying to time the market or pick tops or bottoms.

Nvidia's chart illustrates the importance of technical analysis in evaluating stock performance, despite strong fundamentals.

The AI space, led by companies like Nvidia, is expected to have significant growth potential in the future.

Seasonality can play a role in market movements, with historical data suggesting a tendency for the market to stall or decline after May.

Market corrections often follow a pattern of retracing to a certain percentage above the start of the rally.

Gold has reached new all-time highs, potentially indicating a shift in investor sentiment and economic concerns.

Bitcoin's parabolic rise to new all-time highs may not be sustainable and could be followed by a significant correction, as seen in past cycles.

Real estate and related sectors like home builders and lumber may be facing a high-risk situation due to a potential downtrend in the housing market.

The strategy of focusing on one asset at a time, moving up in favor of risk tolerance, can help sidestep market weaknesses and capitalize on strengths.

Maintaining a portion of the portfolio in cash or short-term treasuries can provide stability and income while waiting for new market setups.

Transcripts

play00:00

do markets have a have a pattern or a

play00:03

habit of correcting to a certain level

play00:05

or a certain percentage decline or to a

play00:08

certain past key level here yeah yeah

play00:11

they do there's there's um you know

play00:14

Fibonacci Works in all kinds of ways we

play00:15

can extend it higher so a Fibonacci

play00:17

extension figure out the momentum to the

play00:19

upside but we can also use a Fibonacci

play00:21

retracement which is figuring out hey if

play00:24

the market rolls over from here how much

play00:25

energy how much selling pressure is

play00:27

going to hit so we could look at the

play00:29

market from a few different uh depending

play00:31

on how how far back you want to go we

play00:33

could look at the the rally we saw from

play00:35

October of last year which would more or

play00:38

less um you know I'll grab the SP 500

play00:40

futures and if we were to pull that up

play00:44

we can see how far this Market could

play00:46

actually uh pull back over the next you

play00:50

know maybe sometime over the next few

play00:52

months um it's got potential to pull

play00:54

back to roughly uh

play00:56

$4,700 which is uh right into this

play00:58

middle of this consolidation right here

play01:00

it's kind of hard to see on this chart

play01:02

but it's right here so the market likes

play01:04

to pull back 38% of whatever the initial

play01:07

rally was so 38% or 50% or 68 so this is

play01:12

kind of that sweet spot where the market

play01:14

likes to pull back what happens when an

play01:16

asset reaches a market top should we buy

play01:18

sell or hold what is the sell signal

play01:21

let's talk about these topics with our

play01:23

next guest Chris M Mulan Chief Market

play01:25

strategist at thetechnicaltraders decom

play01:28

but first a shout out to our sponsor

play01:29

iust Capital an IRA that offers 35

play01:32

crypto assets and the lowest trading

play01:34

fees in the crypto Ira space at 1% if

play01:37

you're over 18 and you want to open a

play01:38

new account or roll over an existing

play01:40

account with cash click on it trust.

play01:43

capital David in the link down below to

play01:45

learn more and find out why itust also

play01:48

has unique tax benefits with Bitcoin now

play01:51

above $70,000 once more and we'll be

play01:53

talking about Bitcoin today and Irma may

play01:56

be the place to place your Bitcoin and

play01:58

crypto returns Chris welcome back to the

play02:00

show good to see you hey thanks David

play02:02

always a pleasure uh everything's moving

play02:05

up to new all-time highs stocks the

play02:07

NASDAQ gold Bitcoin

play02:11

what I don't remember last the last time

play02:13

we had everything move up together to

play02:15

new alltime highs was in 2020 um that I

play02:18

can recall when the Fed was releasing

play02:21

unlimited quantitative easing that's not

play02:24

what's going on today there's no

play02:25

unlimited QE in fact the FED is

play02:27

initiating QT quantitative tightening to

play02:30

the reverse people are talking about a f

play02:32

pivot um cut so so you know uh cutting

play02:37

rates later but that's that's later

play02:38

that's not now my point is Chris what is

play02:41

driving everything up at the same time

play02:43

do you have a

play02:45

theory yeah well to be honest I think I

play02:47

would argue that I wouldn't say

play02:49

everything is actually going up I I

play02:50

think you you rhymed off the things that

play02:52

are going up but if we peel it back and

play02:54

and get away from just the NASDAQ the

play02:57

the SP 500 which is super tech heavy if

play02:59

if you look at the equal weighted sp500

play03:02

it's really just come up to a double top

play03:04

you look at the Russell 2000 it's

play03:06

nowhere near all-time highs most sectors

play03:09

are struggling so to me the market has

play03:12

got this whole this this this you know

play03:14

it it's masking what's really happening

play03:17

most a lot of portfolios aren't doing

play03:19

that well unless you are super tech

play03:20

heavy and focusing on on the indexes the

play03:23

big indexes themselves because we're

play03:25

seeing the majority of sectors

play03:26

floundering there they've had a rally

play03:28

they've done well but they're not near

play03:30

all-time highs so there's there's kind

play03:32

of a mixed bag depending how you look at

play03:34

it but really the markets have that Vibe

play03:36

like they are hitting new all-time highs

play03:39

um but those who are heavy into stocks

play03:41

and smaller cap stocks are really

play03:43

struggling they're not actually doing

play03:44

all that well okay I do want to come

play03:47

back to specific assets and markets so

play03:49

we'll talk about gold today we'll talk

play03:51

about the tech stocks we'll talk a

play03:53

little bit about Bitcoin the dollar um

play03:55

and any other trades are following but

play03:57

just to come back to what you're saying

play03:58

so yes the small caps have lagging some

play04:00

people have told me that because they're

play04:03

lagging now is a good time to buy the

play04:05

laggers because eventually either the

play04:09

large caps come down to meet the small

play04:10

Caps or the small caps go up and meet

play04:12

everything halfway so what's your take

play04:15

is this a good buying opportunity for

play04:17

the

play04:18

Russell uh I I really I don't believe it

play04:21

is I if I I'll show you the chart so if

play04:23

we take a look at the uh the chart here

play04:26

this is the Russell

play04:27

2000 and more or less uh it kind of put

play04:30

in a pretty major major top back in 2020

play04:34

uh 2021 um right through that whole

play04:37

window and it's broken down it has a

play04:39

it's had a very nice rally we could

play04:40

argue it's it's got a base uh and it it

play04:43

might want to Rally higher but overall

play04:44

it's at a major major resistance area I

play04:48

believe this is still kind of more so um

play04:50

last people moving into the stock market

play04:52

as you and I are recording this we're

play04:54

seeing the major indexes are down but

play04:55

the Russell 2000 is up today and that I

play04:58

think we're seeing the Russell 2000 is

play05:00

the market is attracting a lot of small

play05:02

aggressive Traders people who missed out

play05:04

on the big moves people who haven't been

play05:06

involved in the markets and I think

play05:08

we're seeing them move back into a very

play05:10

aggressive stocks we have been seeing

play05:12

like the AR ETFs move up and and the

play05:13

Russell 2000 they're all kind of moving

play05:16

actually pretty much in sync together um

play05:18

but but in the grand scheme of things I

play05:21

think this Market is is is actually kind

play05:23

of at resistance I think it's a false

play05:26

kind of Rally or it's not one that's

play05:28

supported for something really big

play05:30

I I still believe we're in this stage

play05:32

three topping phase and this is what the

play05:34

the pattern of the Russell 2000 is doing

play05:36

this is what a lot of different sectors

play05:38

are doing and uh we're nowhere really

play05:40

near the highs and and this is what

play05:42

happens from an emotional standpoint

play05:45

right now people are in this complacency

play05:46

mode you just mentioned people think

play05:47

it's it's an opportunity to buy they

play05:49

think we're starting something new and

play05:51

the market has put in a big base it's

play05:53

held its ground the NASDAQ and sp500 are

play05:56

hitting new all-time highs giving people

play05:58

this false sense of oh the markets are

play06:00

really strong but underneath if you peel

play06:03

back the layers from those big uh big

play06:05

indexes and take the seven big Tech comp

play06:07

companies out of there the market is

play06:09

struggling in a topping phase but it's

play06:11

making people think hey the Market's

play06:13

cooling off it's taking a breather this

play06:15

is an opportunity to get in and it's

play06:17

going to go higher and I believe it's

play06:18

going to go the other way eventually now

play06:21

don't get me wrong I'm long the markets

play06:23

I'm strong I still think we're actually

play06:24

going to Rally higher here for I think

play06:26

several more weeks uh but but I do think

play06:29

it it is getting very close to the end

play06:30

it feels like the last people are just

play06:32

little bit of money squeezing into this

play06:34

market we've had a couple big days where

play06:36

we've seen heavy heavy selling volume

play06:38

across all asset classes so that to me

play06:40

is a distribution day there's some big

play06:42

funds out there starting to lighten

play06:43

their portfolios because I think they

play06:46

see the music kind of coming to an end

play06:47

so that's how that's how I kind of see

play06:49

the market at this point I think that's

play06:51

the key you think there's going to be a

play06:53

correction at some point but you're

play06:54

still long there's still some juice to

play06:56

be squeezed out I see this in the

play06:57

comments in our prior interviews by the

play06:59

way you know check out Chris's prior

play07:01

interviews with me I'll put a few in the

play07:03

link and in the links down in the

play07:05

description below uh but people have

play07:07

been asking is Chris bullish or bearish

play07:10

like he sounds like he's both like what

play07:13

what is his actual stance I think you're

play07:15

shortterm bullish your longer term

play07:16

bearish is

play07:18

that yeah exactly and and this is what a

play07:21

lot of people need to try to understand

play07:23

because you and I are we talking on many

play07:25

different levels and so my opinion what

play07:28

I think what you and I are talking about

play07:29

is is just my opinion I I'm bearish on

play07:32

the market I think shortterm we're going

play07:33

higher long term I think late this year

play07:35

could be very very ugly for the stock

play07:37

market um but just because I'm bearish

play07:39

does not mean I am betting against this

play07:41

Market again we are long we ride the

play07:42

trend so there's a big difference

play07:44

between what I say and think is going to

play07:46

happen versus maybe the you know the PO

play07:48

positions we actually have going on okay

play07:52

and people who are perhaps new to your

play07:54

work you know Follow Chris we'll talk

play07:56

about your work in just a bit they might

play07:58

think okay that just sounds like a

play08:00

contradiction now can you explain that

play08:02

thought process why would he be bearish

play08:05

why would he think a certain way but do

play08:06

the exact

play08:08

opposite right so trying to time a

play08:10

market as everyone knows is pretty

play08:12

difficult it's a it's a pretty high

play08:13

gamble so technical analysis which means

play08:16

I follow price I follow Cycles sentiment

play08:19

money flows all kinds of different

play08:20

things technical analysis gives me the

play08:22

insight to see what kind of power and

play08:24

strength is behind certain moves and

play08:26

everything in the stock market well in

play08:28

the financial industry is linked in some

play08:30

way it's called intermarket analysis so

play08:33

if one asset class is going down it

play08:34

could be gold could be uh stocks could

play08:37

be whatever that money that's coming out

play08:39

of that asset is going to be flowing

play08:41

into another asset so um depending where

play08:44

money is Flowing between all of these

play08:46

assets we can get an idea as majority of

play08:48

money coming out of say the stock market

play08:49

and flowing into a bunch of defensive

play08:51

sectors or Commodities like gold things

play08:54

like that um and so the nice thing about

play08:56

technical analysis is we follow Trends

play08:59

we we we can identify when something's

play09:00

going up down or sideways and if we want

play09:03

to take advantage of that asset we

play09:04

follow we jump on and we follow that

play09:06

Trend now we might be long the markets

play09:09

which we've been long since November and

play09:11

we're deep in the money and I feel like

play09:12

we're getting real close to a top but

play09:15

we're not going to get out of a trade

play09:16

just because we think um the Market's

play09:18

going to top out and the technicals are

play09:20

slowly starting to weaken telling us hey

play09:22

we're getting closer but we never jump

play09:24

ship until the ship actually turns a

play09:26

corner once it's turned then we get off

play09:28

and go okay it is actually going down

play09:30

let's get off so you know we don't ever

play09:32

try to pick a top or a bottom uh that

play09:35

becomes a very painful game especially

play09:36

if the market keeps going up like right

play09:38

now a lot of people try and pick a top

play09:39

they get out they think it's done it

play09:41

just keeps going higher and then they

play09:42

get left behind so we're more of a trend

play09:45

following strategy and have a very good

play09:46

way to identify when that trend is

play09:49

breaking down through a lot of different

play09:51

layers of analysis can we um take a

play09:54

stock and illustrate that point using an

play09:57

actual chart let's take Nvidia for

play09:58

example it's breaking headlines making

play10:00

the news it's consistently it's a stock

play10:02

that's consistently defied not just

play10:04

gravity but also expectations for their

play10:06

earnings um the sales numbers are going

play10:08

through the roof um they're just they've

play10:11

just come out with a new chip and the

play10:13

point I'm trying to make is that the

play10:14

company may have solid fundamentals to

play10:16

back this chart pattern but despite even

play10:20

what may seem like solid fundamentals

play10:22

you you're a charter you take a look at

play10:23

what's going on or what has happened in

play10:25

the last four weeks and you might think

play10:28

to yourself that looks strange would you

play10:31

you know if I were in would I should I

play10:34

be taking profits should I be cutting my

play10:36

should I be cutting my losses if I were

play10:38

short you know a lot of questions might

play10:40

come into your mind looking at that

play10:41

chart what are some questions you have

play10:43

as a Trader just looking at that chart

play10:45

what would you like to learn a bit more

play10:48

or what more information would you need

play10:50

to gather about that particular stock

play10:53

before you either make a sell or buy or

play10:55

hold decision so let's all right so if

play10:58

we take a look at the daily chart of

play11:00

Nvidia and we look at this this big

play11:01

rally that really took place from mid uh

play11:05

2022 I like to use Fibonacci extension I

play11:07

find this is one of the most powerful

play11:09

tools for identifying how much momentum

play11:12

how much upside potential is in a trade

play11:14

and so if we were to take this low and

play11:16

go up to this high that we saw in 2023

play11:19

and come down to this low and carry it

play11:21

forward it gives us an idea of where

play11:24

this Market should run to and um you and

play11:26

I I think talked about this a while back

play11:29

long story short is if the market

play11:31

rallies up to this Orange Line the 618

play11:35

and it has a little bit of a pause we

play11:37

almost always see it rally up to the

play11:39

100% measured move and how that all that

play11:42

how that works really is just based on

play11:44

the strength that it took in this first

play11:46

run if this continues this chart pattern

play11:49

it should have the same strength to run

play11:50

that same amount to the upside and this

play11:54

is a very large chart pattern the fact

play11:56

that we hit that once we go beyond it

play11:58

we're kind of in in shortterm kind of

play12:00

kind of bubble phase now nvidia's got a

play12:03

really good story I mean they're kind of

play12:05

leading in the AI space they have a new

play12:06

chip I mean the AI space it has moved a

play12:09

lot in the last year it's in everything

play12:12

in fact I think you might have saw a

play12:13

flash of of this image here uh a minute

play12:16

ago on my screen like AI is now in

play12:19

toothbrushes like like where is it going

play12:22

to end but all this stuff all this AI

play12:24

stuff most of it now to me is really

play12:26

just that must be a marketing gimmick I

play12:28

mean what

play12:29

Ai and toothbrushes what what what is it

play12:31

going to do figure out your brush

play12:33

pattern and then like adjust it

play12:35

sensitivity like what is it and this is

play12:37

what I mean like AI is now getting

play12:39

squished into everything as a marketing

play12:41

tool we're really but we're really just

play12:43

scratching the service I'm going to look

play12:45

that up or be with AI I'm going to look

play12:47

that up later any exactly but AI has got

play12:50

so much room to go in the in the film

play12:52

industry and every industry like we're

play12:54

really just tip of the iceberg so

play12:55

there's a lot of you know uh

play12:57

fundamentally Nvidia or even anything in

play13:00

the AI space fundamentally his this

play13:02

Market is just starting I mean it's

play13:04

going to be absolutely massive so there

play13:06

could be one sector that bucks say a

play13:09

much larger market correction and that's

play13:11

probably going to be the AI space

play13:12

because it's really like infinite at at

play13:14

this point in my mind of how far ai ai

play13:17

can actually go but you wanted to know

play13:19

what would I KN need right now to take

play13:22

advantage of this trade so we could look

play13:24

at a couple different things here on

play13:26

this chart say for example like right

play13:28

now it's starting to look pretty strong

play13:30

it is coming up you could you could

play13:31

argue this is a bit of a double top but

play13:33

if we take a look at this last run that

play13:35

really broke down from this low pre-

play13:37

earnings we had a run up I'm using

play13:40

Fibonacci extension here I'm going to

play13:41

Mark the high and then Mark this low

play13:44

this is going to tell us where the next

play13:46

upside targets are for NVIDIA and that

play13:49

is the 100 or the 1025 Mark and then the

play13:55

1130 uh 39 Mark so there's another

play13:58

fairly easy potentially 20% upside in

play14:01

Nvidia and I've been kind of picturing

play14:04

this in my head for a while that we're

play14:05

going to see this one final push kind of

play14:07

going into May or near may just because

play14:10

seasonality wise is when we usually see

play14:11

the market start to stall out uh and

play14:14

people are really going to Pile in like

play14:16

hearing Nvidia break to new highs uh and

play14:18

and this push for some reason I feel

play14:20

like people are Super Hyper sensitive to

play14:22

it and they're going to Pile in and

play14:23

we're going to see the stock market and

play14:25

and potentially the Russell 2000 really

play14:27

kind of pop and squeeze higher and

play14:29

really get a lot of people involved and

play14:31

then this summer people are going to be

play14:32

shaking their heads when things start to

play14:34

potentially plummet and uh they'll be

play14:36

like I can't be believe I just bought

play14:38

into this euphoric hype where I thought

play14:40

I was going to like you know nail it so

play14:43

the the the adage uh by a man go away is

play14:47

there any truth to that speaking of

play14:49

seasonality yeah there there is I mean

play14:52

if we if we take a look at an average of

play14:54

the last 30 years of the SP 500

play14:56

typically after May so pretty much

play14:59

starting in June the market wants to go

play15:01

sideways or lower into the end of the

play15:03

year in fact if you were to Overlay the

play15:05

SP 500 chart on this from last year just

play15:07

locking up last year's price action it's

play15:10

exactly like this like almost to the te

play15:13

so it is it is pretty powerful I

play15:15

wouldn't use it for trading I would use

play15:17

a real strategy this is just um it's

play15:20

just interesting to have a bias of okay

play15:22

you know we might be stalling out I like

play15:24

to be mentally prepared for what could

play15:26

happen so that when trades happen and

play15:29

stops get hit or Trend reverses I'll be

play15:30

like well I kind of knew that was likely

play15:32

to come it's not going to be a shocker

play15:34

it's when people are shocked and

play15:35

something happens faster than they

play15:36

expected they don't want to get out of

play15:38

that trade and it usually costs them

play15:39

because they kind of have analysis

play15:41

paralysis and they're kind of just not

play15:43

ready for it so being mentally prepared

play15:46

is to me is one of the biggest parts of

play15:48

trading um when for the next question

play15:51

perhaps you'll need to pull up a chart

play15:53

to illustrate your point but um when a

play15:56

compl when the complacency phase is over

play15:58

Chris and the market does eventually

play16:00

start correcting whether it be a market

play16:02

or just an individual stock or security

play16:05

uh do we have any indication or um or

play16:10

evidence from the past as to how far

play16:13

that correction could go in other words

play16:15

do markets have a have a pattern or a

play16:18

habit of correcting to a certain level

play16:20

or a certain percentage decline or to a

play16:23

certain past key level here yeah yeah

play16:27

they do there's there's um you you know

play16:29

Fibonacci Works in all kinds of ways we

play16:31

can extend it higher so a Fibonacci

play16:33

extension figure out the momentum to the

play16:34

upside but we can also use a Fibonacci

play16:36

retracement which is figuring out hey if

play16:39

the market rolls over from here how much

play16:41

energy how much selling pressure is

play16:42

going to hit so we could look at the

play16:44

market from a few different uh depending

play16:46

on how how far back you want to go we

play16:48

could look at the the rally we saw from

play16:51

October of last year which would more or

play16:53

less um you know I'll grab the SP 500

play16:55

futures and if we were to pull that up

play16:59

we can see how far this Market could

play17:02

actually uh pull back over the next you

play17:05

know maybe sometime over the next few

play17:07

months um it's got potential to pull

play17:09

back to roughly

play17:11

$4,700 which is uh right into this

play17:14

middle of this consolidation right here

play17:15

it's kind of hard to see on this chart

play17:17

but it's right here so the market likes

play17:19

to pull back 38% of whatever the initial

play17:22

rally was so 38% or 50% or 68 so this is

play17:27

kind of that sweet spot where the Market

play17:29

likes to pull back but if we were to go

play17:31

all the way back to the covid lows it'll

play17:34

give us a much bigger picture of of

play17:36

where those levels are and that brings

play17:38

us all the way back down to more or less

play17:40

um

play17:42

$3,750 uh down to you know $3500 which

play17:45

is right back down to those lows in 2022

play17:48

and that's just that's just a typical

play17:50

that's just a I mean that's just a a

play17:52

correction that's I mean that's a big

play17:54

correction percentage wise that is

play17:55

roughly at this point I mean we're

play17:57

looking at a 29

play17:59

you know 30% pullback and to me that's

play18:03

really just potentially the start of

play18:04

something I think that could be more or

play18:06

less a topping phase a bare Market phase

play18:09

just starting and then we potentially

play18:11

break down and go lower so I mean I've

play18:13

been talking very bearish for a long

play18:15

time on the market and it keeps going up

play18:17

it's more so I'm trying to be mentally

play18:19

prepared and let people realize hey

play18:21

there is going to be Devastation and

play18:23

it's way better to be prepared and and

play18:25

on your game and uh managing positions

play18:27

than to be caught off guard so um on

play18:30

that note I think the key here is that

play18:32

it it'll retrace to a certain percentage

play18:35

uh above the start of the rally you

play18:37

didn't say it's going to retrace to a

play18:39

certain percentage from the top whatever

play18:41

that top may be right so I think what

play18:43

people have to be cognizant of is that

play18:45

the higher where the the higher this

play18:48

markets go the the more pronounced the

play18:50

rally then the larger the correction

play18:53

correct yeah yeah okay that makes sense

play18:56

well let's take a look at something that

play18:58

has reached new alltime highs a couple

play19:00

of things gold first of all um reached

play19:03

2200 not too long ago we at 2174 today

play19:07

as we speak and I have to point out that

play19:12

um on your in your chart showing the

play19:14

phases in the complacency phase things

play19:17

in that well from that particular chart

play19:19

illustrating the example things don't

play19:21

usually breach a the prior alltime high

play19:24

right because you can see they just it

play19:26

just I I I know that's just for

play19:28

illustration purposes but um for the

play19:30

complacency phase you don't see a new

play19:32

high so can you say that gold is in a

play19:34

different

play19:36

phase yeah for sure T typically when we

play19:39

get really close to the end of a major

play19:41

stock market and more so economic cycle

play19:44

we see we see energy stocks we usually

play19:46

see crude oil energy come to life which

play19:49

we energy stocks have been on fire over

play19:51

the last couple of months um we you tend

play19:53

to see gold silver and miners come to

play19:55

life and they have gold has already come

play19:57

to life it's a little more stable but

play19:59

we're seeing Miners and silver big money

play20:01

flows are starting to rotate into them

play20:03

they're moving up um so I I would put

play20:06

the precious metals in a bit different

play20:08

space in a really I would say they're in

play20:10

a they're in a well gold is more so in a

play20:12

bullish space uh M Miners and silver are

play20:15

still struggling but if we were to look

play20:17

at the monthly chart and go back so we

play20:19

had a um uh back over here we had a

play20:22

month multi kind of like a multi-year

play20:25

consolidation and then we saw Gold

play20:27

Silver and miners rally up really well

play20:29

they were in a bull market phase which

play20:30

gold is in a bull market right now um

play20:32

until the stock market topped and so as

play20:35

the stock market was starting to stall

play20:36

out sectors were were failing very

play20:38

similar to what we we're having now um

play20:41

gold did well but then gold corrected

play20:43

with the bare Market well we've had a

play20:45

multi-year consolidation and gold now is

play20:48

is it's rallying it's pushing to new

play20:50

all-time highs because I think a lot of

play20:52

people investors see economic weakness

play20:55

they see they're they're worried about

play20:56

currencies they're worried about all

play20:57

kinds of different things things and

play20:59

people are moving into this space I

play21:01

think it's just starting I think Gold

play21:02

Silver and miners have some pretty good

play21:04

room to run still over the next couple

play21:06

of months and I think it's one of these

play21:09

warning signs that we are slowly getting

play21:11

closer to the end of this kind of

play21:13

economic cycle and we're going to see a

play21:15

bit of a reset so you don't think gold

play21:18

is a uh is overbought compared to Silver

play21:20

in the

play21:21

miners no I I I I mean to me gold is

play21:24

actually much stronger play it's in a

play21:26

uptrend it's breaking to new all-time

play21:28

highs with no overhead Supply it's seen

play21:30

more as an investment people who buy it

play21:32

are are everywhere around the world and

play21:34

they buy it and they usually keep it um

play21:36

silver and miners are more speculative

play21:38

so they get you know pumped and dumped

play21:40

and and dropped and you know they get

play21:42

people get shaken out because they move

play21:43

percentage wise a lot but to me gold is

play21:46

is is more solid and it holds its ground

play21:49

better and it's in a it's in a bull

play21:51

market whereas the precious metal Miners

play21:53

and silver are struggling they're just

play21:55

starting to come to life they haven't

play21:56

really broken out yet okay

play21:59

uh can you say the same thing about

play22:00

Bitcoin is that in new A Renewed bull

play22:03

market I mean bitcoin's been ring ever

play22:07

since last year so I'm wondering if this

play22:09

is oh everyone's wondering not just me

play22:12

everyone's wondering if this is just the

play22:14

continuation of the momentum upwards or

play22:17

are we about to see a top or correction

play22:20

do we necessarily need to have a

play22:22

correction uh once a new high has been

play22:25

breached generally speaking what's your

play22:26

take on bitcoin yeah I mean I'm I'm not

play22:29

a fan of things that go very parabolic

play22:32

things things that go straight up with

play22:34

these these very strong bars I'm I'm not

play22:36

a fan because it means everybody's

play22:38

crowding into it at the same time um the

play22:40

best chart is one that goes literally

play22:43

across your chart on like a 45 degree

play22:46

angle it can do that forever it can just

play22:48

keep going up it has enough of a little

play22:50

bit of a pause and pull back to reset

play22:52

and keep going but something that goes

play22:54

straight up usually Fizzles out and all

play22:56

those people that chased and piled in

play22:58

because they were emotional they had

play22:59

fomo they have to get in they they want

play23:01

to make sure they catch it well when it

play23:03

starts to roll over they also have fear

play23:05

of losing money more money so they bail

play23:07

out and it comes right back down so I

play23:10

consider very strong rallies like these

play23:11

to be um to me they're more like

play23:14

fear-based rallies fomo squeezes them up

play23:17

and then fear of losing money gets

play23:18

drives it right back down again as they

play23:20

all just jump ship and give up um so I'm

play23:23

not a fan like yes Bitcoin is in a very

play23:25

strong uptrend it's got new all-time

play23:27

highs it could keep going

play23:29

um but again I'm I'm not a fan of

play23:32

something that is ripping kind of

play23:33

straight up two months you know back to

play23:36

back uh it usually ends abruptly put it

play23:39

that way what's interesting is that in

play23:42

the prior bull cycles for Bitcoin every

play23:44

time it's breached a new alltime high

play23:46

it's immediately or almost immediately

play23:48

retraced or saw a major correction not

play23:51

saying it's not going to reach new

play23:52

alltime highs I mean clearly it has but

play23:54

um it's just in the past just just like

play23:57

2021 uh double top both times has

play24:00

breached a previous high it's come down

play24:02

so if you were to assume history repeats

play24:05

itself can you make the same assumption

play24:07

again which is that it's about to

play24:09

correct or it's about to see a major

play24:12

some sort of major

play24:14

pullback yeah I yeah that's true I mean

play24:17

Fibonacci the way the markets like to

play24:18

move is it new new Highs are always

play24:22

wanted to be reached and new lows are

play24:23

always wanted to re be reached it's just

play24:26

the way the markets move and it's it's a

play24:28

way to for example we have this high

play24:31

right here and then suddenly we broke it

play24:33

and uh it ended up running higher you

play24:35

know the next month but by the end of

play24:37

that month it's sold off and what it

play24:39

does is when you hit a new high it's

play24:41

everybody who is short gets squeezed out

play24:43

they're like oh I do not want to hold

play24:44

this it's like it's rocketing higher so

play24:46

they get out and as they cover their

play24:48

shorts it makes it creates more buying

play24:49

pressure it goes up and then there's a

play24:51

ton of people who see that quick sharp

play24:53

move and they have to Pile in because

play24:54

they're missing out on the next rally um

play24:57

and then that's usually when there's a

play24:59

lot of people buying buying into it we

play25:01

we tend to see the big players say I got

play25:03

to unload into this and then they unload

play25:05

into the selling pressure they they kind

play25:07

of get out and then all the emotional

play25:08

Traders start to follow suit and bail

play25:11

out after that but it's just the way the

play25:12

markets move you'll notice the market

play25:14

likes to just poke to it I call it it's

play25:16

a nominal new high just high enough to

play25:19

get the shorts out and get anybody who's

play25:21

not in who who's been wanting to get in

play25:23

in because they're now going to have

play25:25

fomo so I'm not a fan of something goes

play25:27

straight up hits a a nominal new high

play25:29

you know next month could be a blood

play25:31

bath it could be a very strong red

play25:33

candle it could easily come back down to

play25:35

50

play25:36

$40,000 I mean that's just what this

play25:38

this chart has done and and at this

play25:41

point you know it's to me I think it's

play25:42

more likely than it is it to keep going

play25:44

straight up uh that's that's interesting

play25:47

and important okay thank you anything

play25:49

else you're watching uh or trading that

play25:52

you have high conviction of either way

play25:54

either bullish or very bearish on I mean

play25:58

we're we're along the indexes I we're

play25:59

along some leverage on the sp500 and the

play26:02

NASDAQ um you know I'm getting excited

play26:06

for potentially a US dollar trade um

play26:09

when we look at the monthly chart of the

play26:10

US dollar it's slowly building a base

play26:12

now there's an ETF for that which is

play26:14

uup um but right now I'm really just

play26:17

interested in the indexes I find the

play26:19

sectors are all over the place and I'm

play26:22

not a fan of the sectors just because

play26:24

they're super volatile they they can

play26:26

perform really well for a couple weeks

play26:28

and then they can perform really poorly

play26:29

a perfect example of that is actually

play26:31

the um uh the marijuana ETF it went from

play26:37

the worst asset on our list of worst

play26:40

asset in the whole pile of sectors to

play26:42

the best one which it is now and it went

play26:44

all the way back to the worst and now

play26:45

it's back to the best and it just has

play26:47

these percentage moves and when sectors

play26:49

are all over the place like that which

play26:51

I've seen a lot over the past year and a

play26:53

half um it's just a difficult space

play26:56

trying to pick sectors and jump around

play26:58

so so I like to just focus on the stock

play27:00

market it's like the tide if the Tide's

play27:02

going up you know most it raises most

play27:04

boats so I just jump in i r play the

play27:06

tide with an index plate at this point

play27:09

it's the easier safer money and if you

play27:12

want you can use leverage to get more

play27:14

movement out of it I think when we start

play27:16

a a brand new Raging Bull market like a

play27:18

stage two which whenever that happens I

play27:21

don't believe we're in it yet um that

play27:24

then sectors and stocks become very very

play27:26

exciting again but right now index to me

play27:29

is the safer easy way to pull money out

play27:31

of the market confidently comfortably

play27:34

and not take on too much risk uh so

play27:37

you're right um my opening statement was

play27:39

technically incorrect not everything's

play27:41

going up I I was exaggerating uh but one

play27:43

thing that hasn't been going up to new

play27:44

highs is actually um if you take a look

play27:47

at certain real estate ETFs this there's

play27:49

a lot of them out there for uh various

play27:52

compositions so we can't make a

play27:53

generalization but I'm just taking a

play27:55

look at bnq which is a Vanguard real

play27:57

estate have one of the largest uh

play28:00

they've got a mix of a lot of different

play28:02

stuff in there um are you surprised that

play28:04

real estate as a as an asset class

play28:06

hasn't been I guess outperforming the

play28:09

stocks this

play28:11

year Well real estate struggling I am

play28:14

not I've been bearish on real estate for

play28:15

quite a while I I think it's going to

play28:17

get beat up pretty hard I I think the I

play28:20

think the average investor or the the

play28:23

basic real estate investor who's trying

play28:24

to just get into the space and buy a

play28:26

duplex or put in a you know accessory

play28:29

apartment or something like that they're

play28:30

all super bullish on the markets but the

play28:32

reality is real estate is is softening

play28:34

huge I know people with subdivisions who

play28:37

are working with people subdivision

play28:38

people are backing out they're breaching

play28:40

contracts they do not want to walk into

play28:42

this um prices are dropping in a lot of

play28:45

places and and we can see that here on

play28:47

on this now um if we take a look at for

play28:50

example um H what is it um the home

play28:53

builders H xhb here if we take a look at

play28:56

this this is the Home Builders and this

play28:58

is be people are piling into the home

play28:59

builder stocks because they think we're

play29:01

going to start another housing bubble

play29:03

and so to me people are moving in

play29:05

thinking the housing market is amazing

play29:07

which I believe it's complete opposite I

play29:08

think it's maximum risk and I think

play29:11

these home builders are going to get

play29:12

really really hit because they're going

play29:13

to realize holy we're building all these

play29:15

homes now we got to sell them try to

play29:17

sell them and we got to give them away

play29:19

and um people are going to be stuck and

play29:22

it's the same with we can take a look at

play29:24

people are piling into the wood industry

play29:26

the lumber the wood ETF um we we've seen

play29:29

in the last little bit it's actually had

play29:30

a very strong run people are moving into

play29:32

the the wood industry um just as much as

play29:35

the home builders over the last little

play29:37

bit but when we step back just like the

play29:39

real estate chart that you had me pull

play29:41

up there we're really seeing the lumber

play29:43

industry is really at resistance and I

play29:46

think in the grand scheme of things soon

play29:49

as housing really kicks in and slows

play29:51

down we're probably going to see lumber

play29:53

prices fall the lumber companies are

play29:54

going to suffer dramatically um so a lot

play29:57

of charts this this is what a lot of

play29:58

sectors look like they put in a major

play30:00

top in 21 22 they're putting in this

play30:03

this rounding bottom and or kind of base

play30:05

or this bare flag really and they're all

play30:07

stuck under this resistance so I believe

play30:09

we're very close to a bigger leg down

play30:12

and and real estate there's going to be

play30:14

a lot of people caught off guard in real

play30:15

estate I had lunch with somebody not

play30:17

that long ago and they're like you know

play30:19

super gung-ho they're looking to buy

play30:21

everything they can and they think real

play30:23

estate is this is a perfect time to buy

play30:26

and to me it's the complacency I'm like

play30:28

just because it's paused and starting to

play30:30

weaken doesn't mean it's an opportunity

play30:31

it could actually mean we're starting a

play30:33

big downtrend but they don't see that

play30:34

they just say I need to get more

play30:36

properties and I think it's a highrisk

play30:38

play we have a few minutes left I want

play30:40

to talk a little bit about your service

play30:41

first of all how much cash do you have

play30:42

right now you said you're mostly long

play30:43

the indices so I'm guessing not a lot of

play30:46

cash relative to your overall position

play30:48

we're we're 50% we're 50% in in cash

play30:51

right now for those of us watching right

play30:53

now who are not familiar with um Chris's

play30:55

work I mean he's been on the show

play30:57

several times at at various points

play30:59

you've been either 100% in cash or 100%

play31:02

in markets now you're

play31:04

50/50 um if you were to summarize in one

play31:07

or two sentences what your sentiment is

play31:09

towards the markets you know why what

play31:12

what is your sentiment and how does that

play31:13

reflect in your cash

play31:15

position right so long story short is we

play31:18

were 100% invested in the stock market

play31:20

uh half in the SP 500 half in the NASDAQ

play31:23

we've got this beautiful Rally from the

play31:25

November lows uh no November rally uh

play31:29

last year and we've we've hit all all of

play31:31

our key targets uh and usually

play31:34

statistically when the market has done

play31:36

what it has done we recently got out of

play31:38

half half of the position uh the stock

play31:40

market goes in into a pretty big

play31:41

correction a multi-week multi-month

play31:43

correction and uh so our strategy is

play31:46

simply saying hey we've reached all of

play31:47

our targets um the techn believe it or

play31:50

not the technicals on the NASDAQ have

play31:52

told us to get out and so we got out of

play31:54

the N have you been taking profits on

play31:56

the way up yeah

play31:58

yeah yeah we we scale out on targets but

play32:01

we're having a great year I mean we're

play32:02

up like you know 10% on the year which

play32:04

is actually outperforming the market

play32:06

which is pretty pretty amazing oh

play32:08

congrats and uh summarize your strategy

play32:10

for us in uh in 90 seconds or less for

play32:13

those of us who are just learning about

play32:15

you super high level I focus on uh a

play32:19

strategy what I call is asset Reves we

play32:21

own one asset at a time so one ETF the

play32:25

stock market is one asset you know it

play32:28

doesn't matter how many stocks you own

play32:29

equities is an asset bonds is one asset

play32:32

a currency like the dollar Index is one

play32:34

asset we only own one asset that is

play32:36

moving up in favor of our risk tolerance

play32:39

and right now we are in the stock market

play32:41

because it's favorable it has the most

play32:43

potential uh we also have half our

play32:46

portfolio in B which is a um short-term

play32:49

treasury note so we earn daily interest

play32:51

in and monthly dividends for the other

play32:53

Port portion of our cash until we get a

play32:55

new setup so we just focus on only

play32:57

holding the asset an asset that's going

play33:00

up we don't hold anything going down or

play33:02

sideways and um allows us to sidestep

play33:04

the market when it's not strong and only

play33:06

own the best assets uh when the Market's

play33:09

moving well I'll put the link to your uh

play33:12

to your website and your service down

play33:13

below uh go click on the link to learn

play33:16

more about Chris's uh asset Reves

play33:19

strategy and of course there's prior

play33:21

interviews I've done with Chris that

play33:22

I'll also put in the description down

play33:24

below we've talked about his strategy um

play33:26

at length in some of these prior

play33:28

interviews so check them out and uh

play33:30

we'll go into a bit more detail next

play33:31

time as well but I want to do a quick

play33:33

market update uh for those of us

play33:35

following the markets are wondering why

play33:37

the things we spoke about not everything

play33:38

but the things we spoke about are just

play33:40

going through the roof so thanks for

play33:42

that update um great great to see you

play33:45

Chris we'll see you again soon yeah

play33:46

thanks David take care take care and

play33:48

thank you for watching don't forget to

play33:50

like And subscribe and follow Chris in

play33:51

the link down

play33:56

below

Rate This
โ˜…
โ˜…
โ˜…
โ˜…
โ˜…

5.0 / 5 (0 votes)

Related Tags
Market AnalysisInvestment StrategyChris M MulanFibonacci ToolsAsset AllocationStock Market TrendsEconomic CyclesReal Estate MarketBitcoin DynamicsTechnical Trading