Media o valor esperado, varianza y desviación estándar de variable aleatoria discreta
Takeaways
- 😀 The script focuses on how to calculate the mean (expected value), variance, and standard deviation of a discrete random variable.
- 😀 The use of a probability distribution table is emphasized as an easy and organized way to perform calculations.
- 😀 The mean is calculated by multiplying each value of the random variable (X) by its corresponding probability (P(X)) and summing the results.
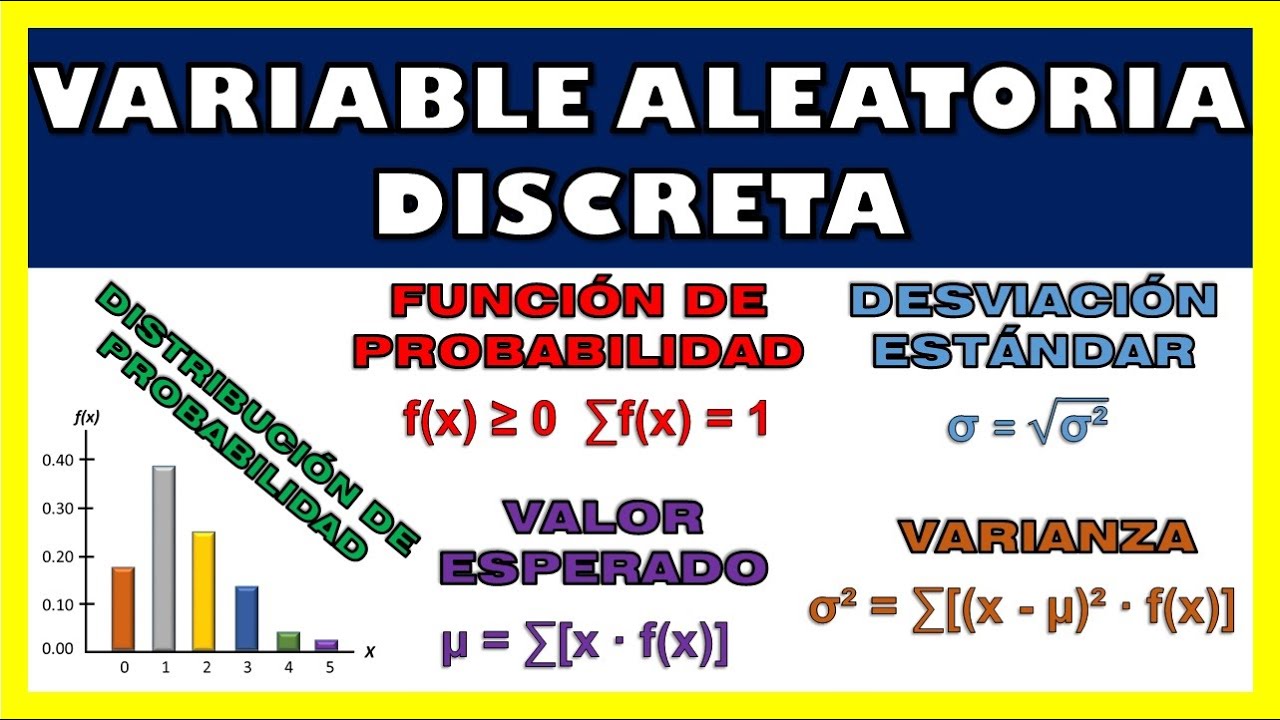
- 😀 The formula for the mean is: μ = ∑(X * P(X)), and this represents a weighted average of the values.
- 😀 The variance measures how spread out the values of the random variable are around the mean, and is calculated by the formula: σ² = ∑(X² * P(X)) - μ².
- 😀 To find the variance, first square each value of X, multiply by the corresponding probability, sum the results, and subtract the square of the mean.
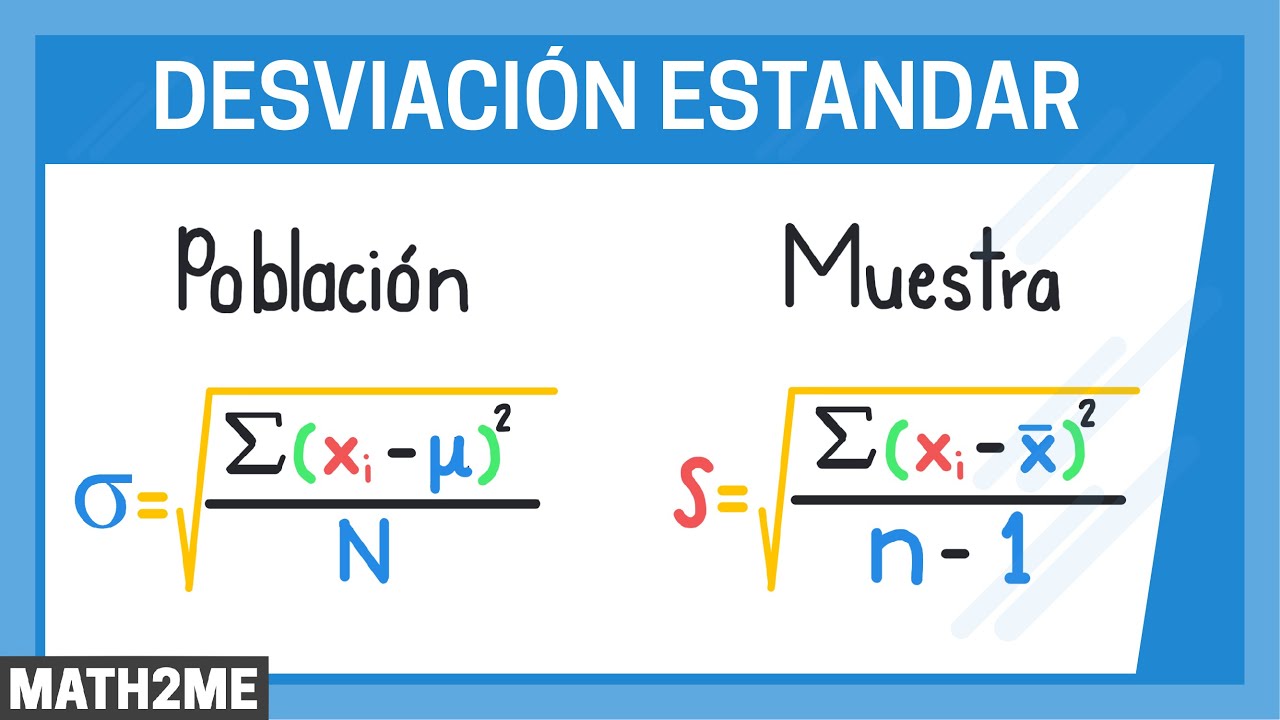
- 😀 The standard deviation is simply the square root of the variance, calculated using the formula: σ = √σ².
- 😀 The script reassures students that although other methods, such as direct formulas, can be used, the probability table method is the most efficient and less prone to error.
- 😀 The importance of checking that the sum of the probabilities equals 1 in the probability distribution is also highlighted as a key verification step.
- 😀 The script concludes by encouraging students to continue practicing and exploring further lessons on random variables and related topics.
Q & A
What is the mean or expected value of a discrete random variable?
-The mean (or expected value) of a discrete random variable is the weighted average of its values, where the weights are the probabilities associated with those values. The formula for the mean is: E(X) = Σ x * P(X).
How do you calculate the expected value from a table of probabilities?
-To calculate the expected value from a table, multiply each value of the random variable by its corresponding probability, and then sum all these products.
In the given example, what is the expected value (mean) of the random variable X?
-In the example, the random variable X takes the values 0, 1, and 2, with probabilities 0.25, 0.50, and 0.25 respectively. The expected value is calculated as (0 * 0.25) + (1 * 0.50) + (2 * 0.25), which equals 1.
What is the difference between variance and standard deviation?
-Variance is a measure of how spread out the values of a random variable are, calculated as the average of the squared differences from the mean. Standard deviation is the square root of the variance, giving a measure of spread in the same units as the original data.
How do you calculate the variance of a discrete random variable?
-Variance is calculated using the formula: Var(X) = Σ (x² * P(X)) - (E(X))². This involves first multiplying the square of each value of X by its probability, summing these products, and then subtracting the square of the expected value from this sum.
In the example, what is the variance of the random variable X?
-In the example, after squaring each value of X (0, 1, and 2), multiplying by the corresponding probabilities (0.25, 0.50, 0.25), and summing the results, the variance is calculated as 1.50 - (1)² = 0.5.
Why is it useful to organize calculations in a table when computing the expected value, variance, and standard deviation?
-Using a table helps keep calculations organized, reduces the risk of errors, and makes it easier to check your work. Each step is clearly laid out, making it easier to track the process for the expected value, variance, and standard deviation.
What is the formula for the standard deviation of a discrete random variable?
-The standard deviation is the square root of the variance. The formula is: σ = √Var(X).
What is the standard deviation of the random variable X in the example?
-In the example, the variance was found to be 0.5. The standard deviation is the square root of 0.5, which is approximately 0.7071.
Can the expected value be a value not listed in the table of possible outcomes?
-Yes, the expected value does not have to be one of the possible outcomes listed in the table. It can be a number that is not directly represented by any of the values of the random variable.
Outlines

This section is available to paid users only. Please upgrade to access this part.
Upgrade NowMindmap

This section is available to paid users only. Please upgrade to access this part.
Upgrade NowKeywords

This section is available to paid users only. Please upgrade to access this part.
Upgrade NowHighlights

This section is available to paid users only. Please upgrade to access this part.
Upgrade NowTranscripts

This section is available to paid users only. Please upgrade to access this part.
Upgrade NowBrowse More Related Video
VARIABLE ALEATORIA DISCRETA | EJERCICIO 1
Media, valor esperado o esperanza de una variable aleatoria discreta

Distribución binomial | Ejercicio resuelto 2: representación mediante tabla y gráfica
Desviación estándar en una población y muestra | Introdución | Fx-991EX
Función de probabilidad y valor esperado de variable aleatoria discreta | Ejercicio |

Introducción a la distribución Normal
5.0 / 5 (0 votes)