Waterloo Hydrogeologic - Analyzing a pumping test in AquiferTest
Summary
TLDRThis tutorial video guides viewers through creating and analyzing a basic pumping test using OER Test software. It begins with setting up a new project, explaining the workflow, and entering essential data such as project details, well information, and pumping rates. The video then demonstrates how to input water level measurements and perform a T analysis, including both manual and automatic curve fitting. It concludes with interpreting the results, showcasing the software's capabilities for hydrogeological analysis.
Takeaways
- 😀 The video demonstrates how to create and analyze a basic pumping test using OER Test software.
- 🔍 The OER Test software is used for hydrogeological analysis, specifically for pumping tests.
- 📝 The workflow in OER Test involves entering data from leftmost to rightmost tabs: pumping test, discharge, water levels, and analysis.
- 💧 The pumping test tab is used to input basic project information and details about the wells involved in the test.
- 📊 The discharge tab allows users to enter data on the rates at which different pumping wells were pumped.
- 📈 The water levels tab is for entering water level measurements from both pumping and observational wells.
- 📋 The analysis tab is where users select the type of analysis, such as the Theis method, and fit it to a type curve.
- 📁 Users can create a map and export reports using additional tabs in OER Test, though these are not covered in the video.
- ⚙️ The video provides a step-by-step guide on how to input data into the OER Test software for a pumping test analysis.
- 📉 The analysis results, including transmissivity and storage coefficient, are displayed in the results pane for each well.
- 🛠️ OER Test offers both manual and automatic curve fitting options, with the latter using the ODAC fit button for convenience.
Q & A
What is the purpose of the video?
-The purpose of the video is to demonstrate how to create and analyze a basic pumping test using OER Test software.
What is the first step in creating a new project in OER Test?
-The first step in creating a new project in OER Test is to ensure that 'Create pumping test' is checked and then select the 'Create a new project' button.
What is the basic workflow in OER Test for analyzing a pumping test?
-The basic workflow in OER Test involves starting from the leftmost tab and working towards the rightmost tabs, entering information and performing analyses step by step.
What are the four essential tabs used in the pumping test workflow?
-The four essential tabs used in the pumping test workflow are the 'Pumping Test' tab, the 'Discharge' tab, the 'Water Levels' tab, and the 'Analysis' tab.
How does one add a new well in the pumping test tab?
-To add a new well in the pumping test tab, one clicks the 'Click here to create a new well' button, which adds a well with the type automatically set to 'Observation well' by default.
What information is entered in the discharge tab?
-In the discharge tab, one enters the pumping data for various pumping wells, including the rates at which different pumping wells were pumped at.
How can variable discharges be entered in OER Test?
-Variable discharges can be entered in OER Test by selecting the 'variable' button and then filling out the table with the time and discharge rate for each pumping period.
What type of data is entered in the water levels tab?
-In the water levels tab, one enters the water level observations for various wells, which can include drawdown data and static water level measurements.
What is the significance of the analysis tab in OER Test?
-The analysis tab in OER Test is where one selects the type of analysis, fits it to a type curve, and can perform multiple analyses on a pumping test if desired.
How can one visualize the drawdown data in OER Test?
-One can visualize the drawdown data in OER Test by selecting the well and checking the box to display the data. The graph can be changed to a log-log form for better visualization of the TI data.
What are the results displayed in the results pane of OER Test?
-The results pane in OER Test displays the calculated best fit parameters such as transmissivity and storage coefficient, which are derived from the analysis of the pumping test data.
Outlines

This section is available to paid users only. Please upgrade to access this part.
Upgrade NowMindmap

This section is available to paid users only. Please upgrade to access this part.
Upgrade NowKeywords

This section is available to paid users only. Please upgrade to access this part.
Upgrade NowHighlights

This section is available to paid users only. Please upgrade to access this part.
Upgrade NowTranscripts

This section is available to paid users only. Please upgrade to access this part.
Upgrade NowBrowse More Related Video

ISTQB FOUNDATION 4.0 | Tutorial 32 | Decision Table Testing | Test Case Design Techniques | CTFL

优选IP维护更新优选订阅器 搭配自建测速地址 XIU2/CloudflareSpeedTest使用教程 CM喂饭 干货满满09 #CloudflareST #优选ip #科学上网 #节点订阅 #翻墙
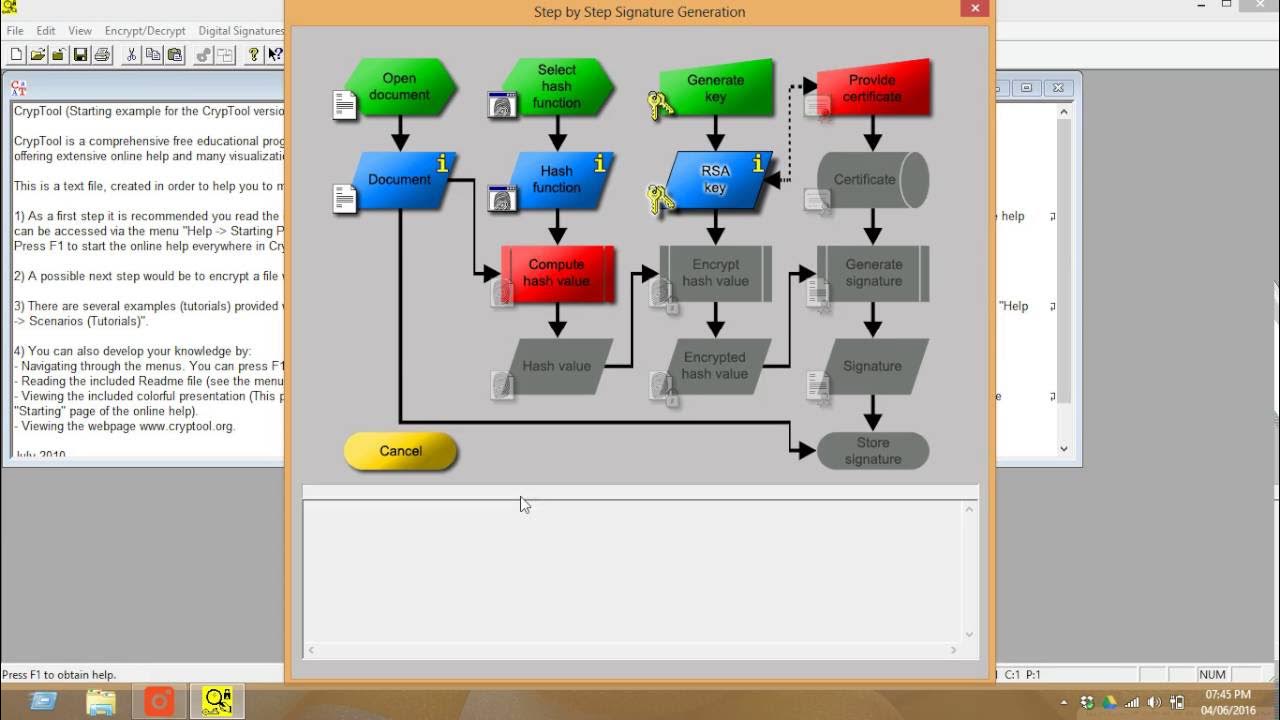
How to use CrypTool for creating the digital signature for documents

Instalasi dan konfigurasi Web Server (NGINX) pada Debian 12

ISTQB v4.0 Decision Table Testing explanation with examples

DevOps Lab Program 7 Execution | VTU 22 Scheme | Ansible Basics & Playbook Automation
5.0 / 5 (0 votes)